Plains GP Holdings, L.P.'s management explains the business in its own materials. The slides below do the most of that work, pulled from the documents preserved in Sources. Each source link opens the complete presentation at that slide in a new tab.
The standing company-overview deck: structure, the PAGP-vs-PAA tax question, asset maps by region, crude macro and the financial framework. · Open the full document →
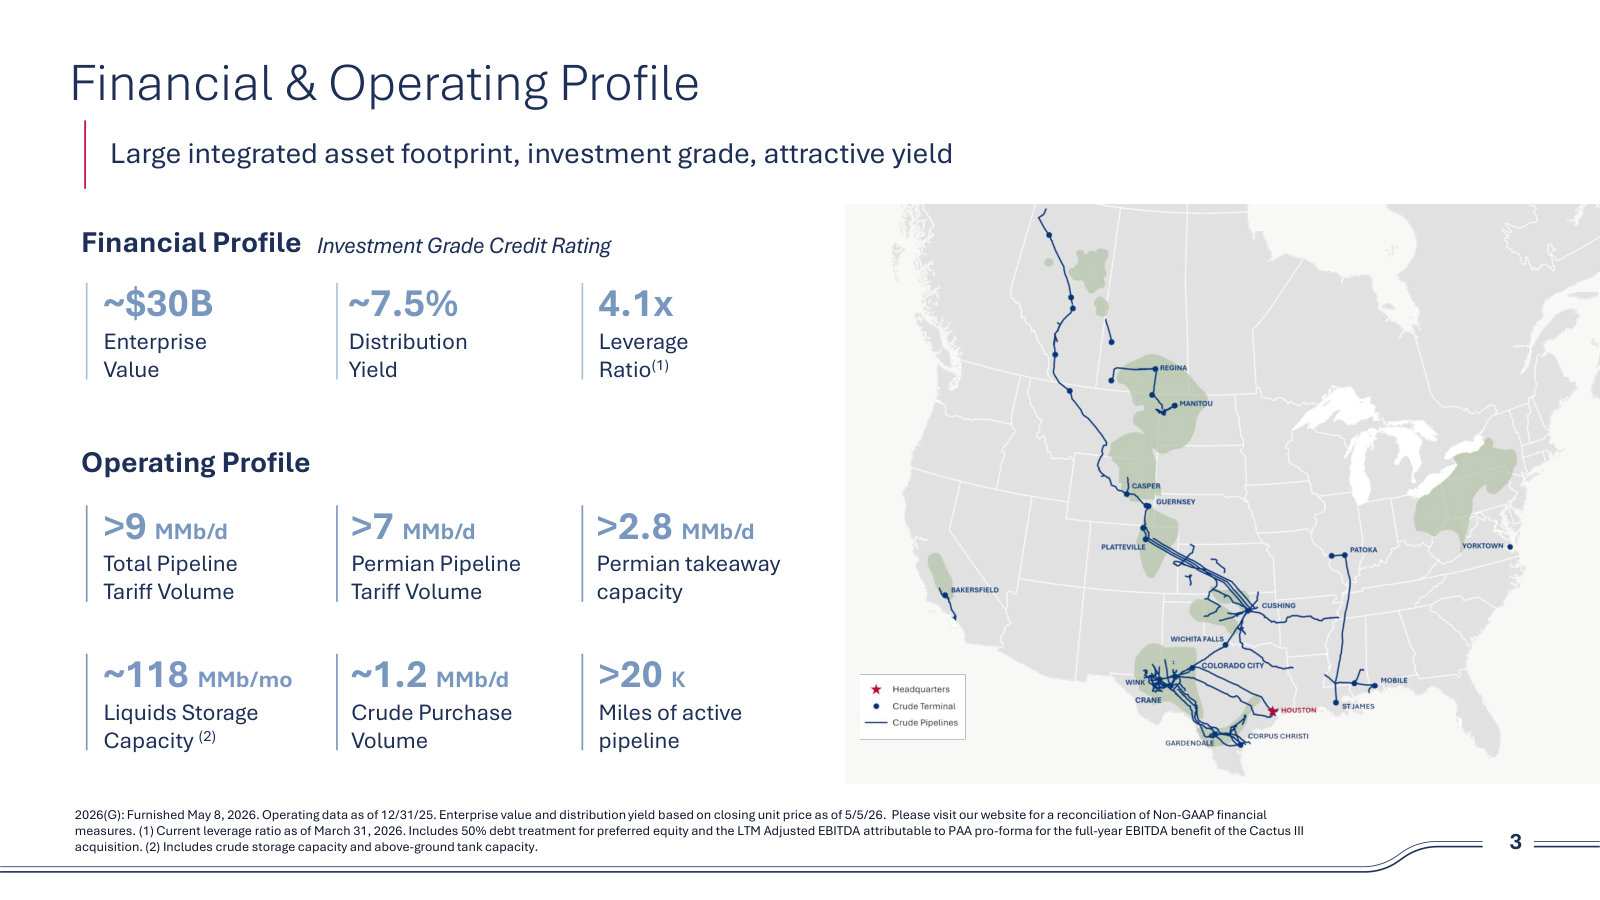
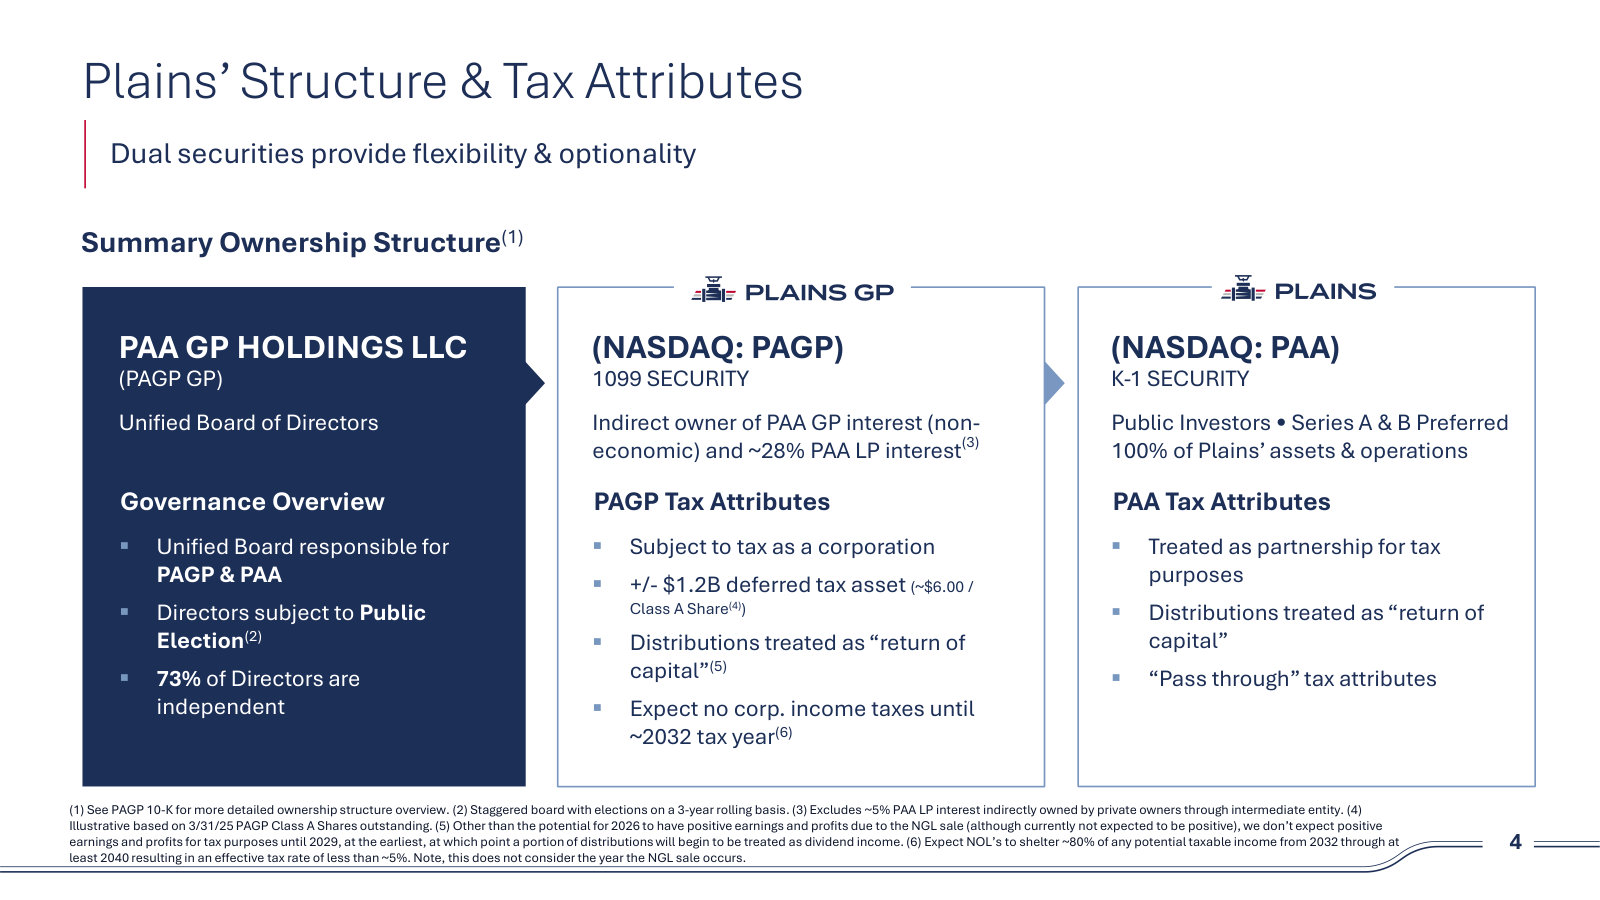
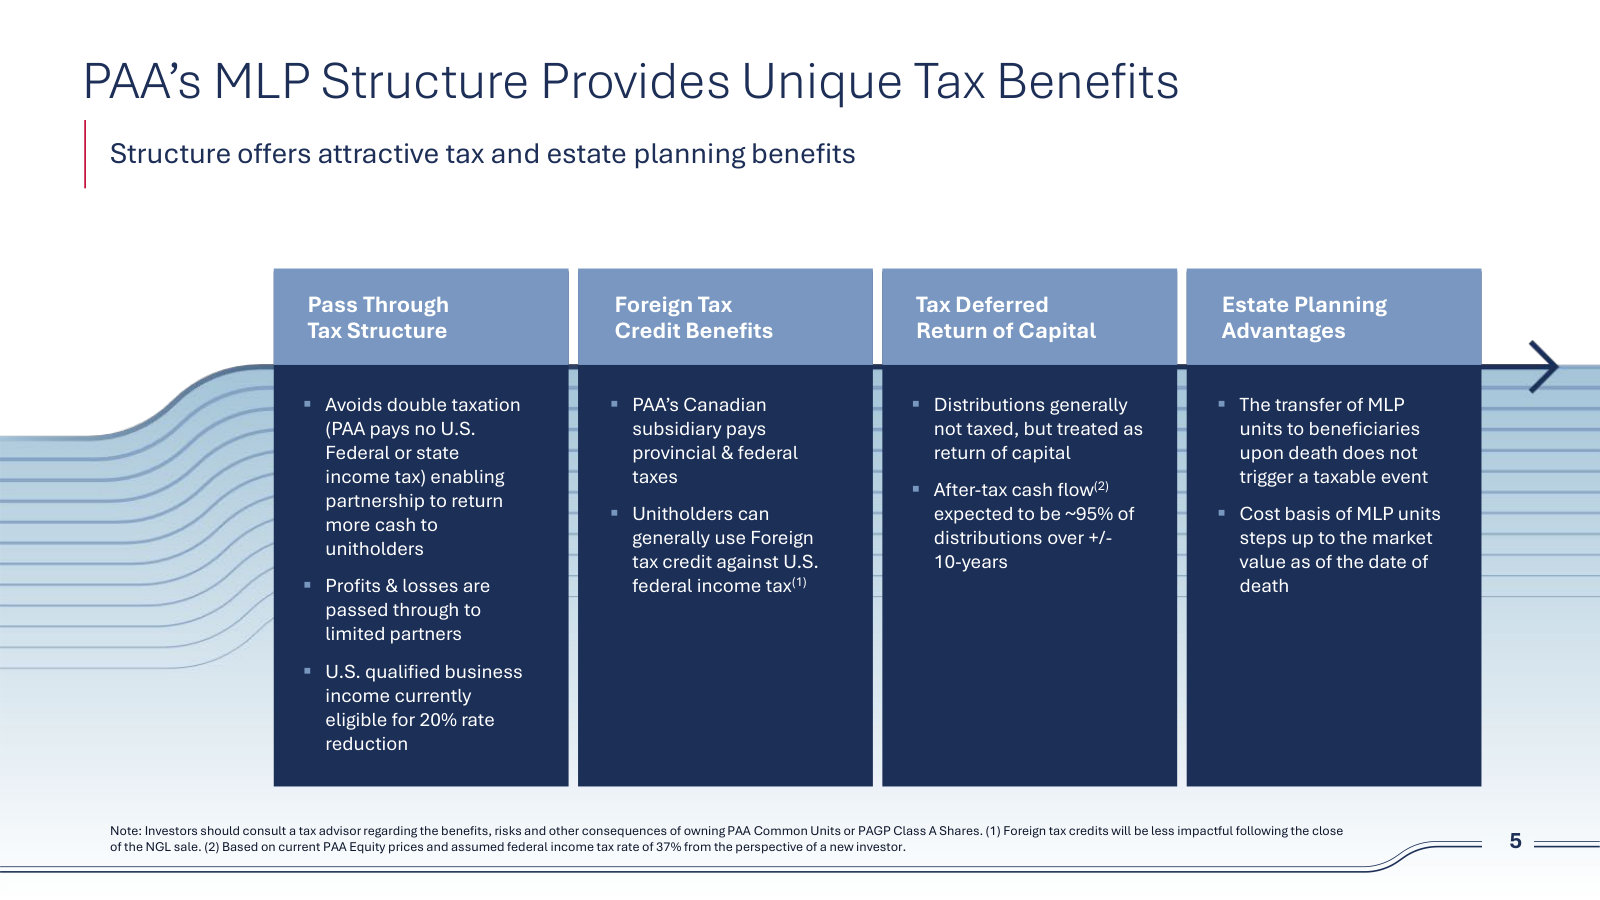
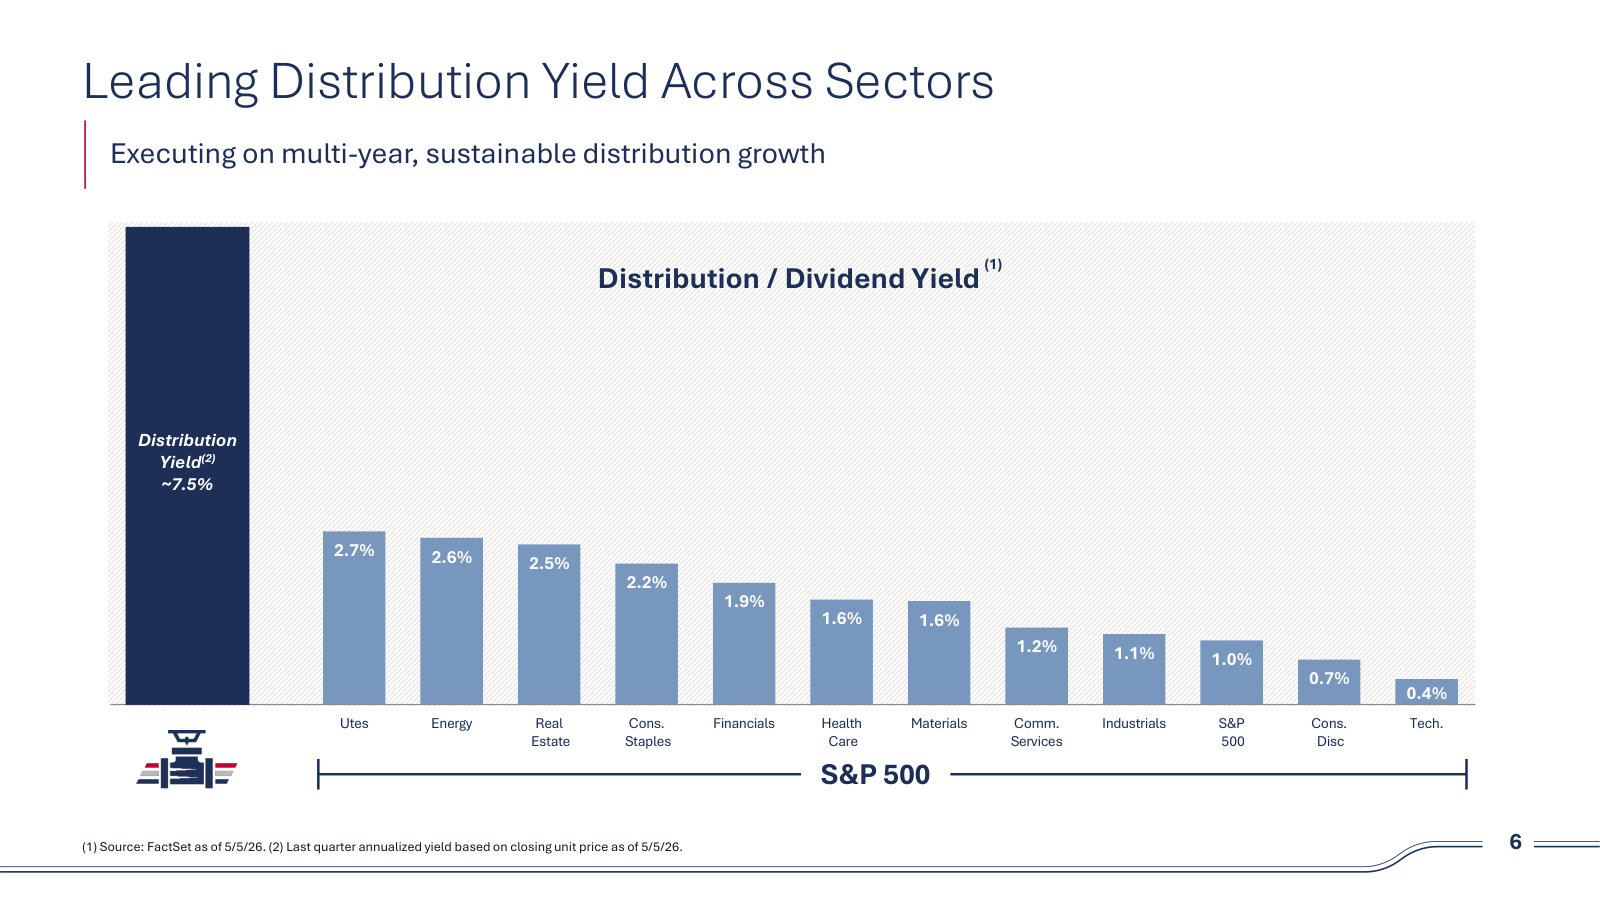
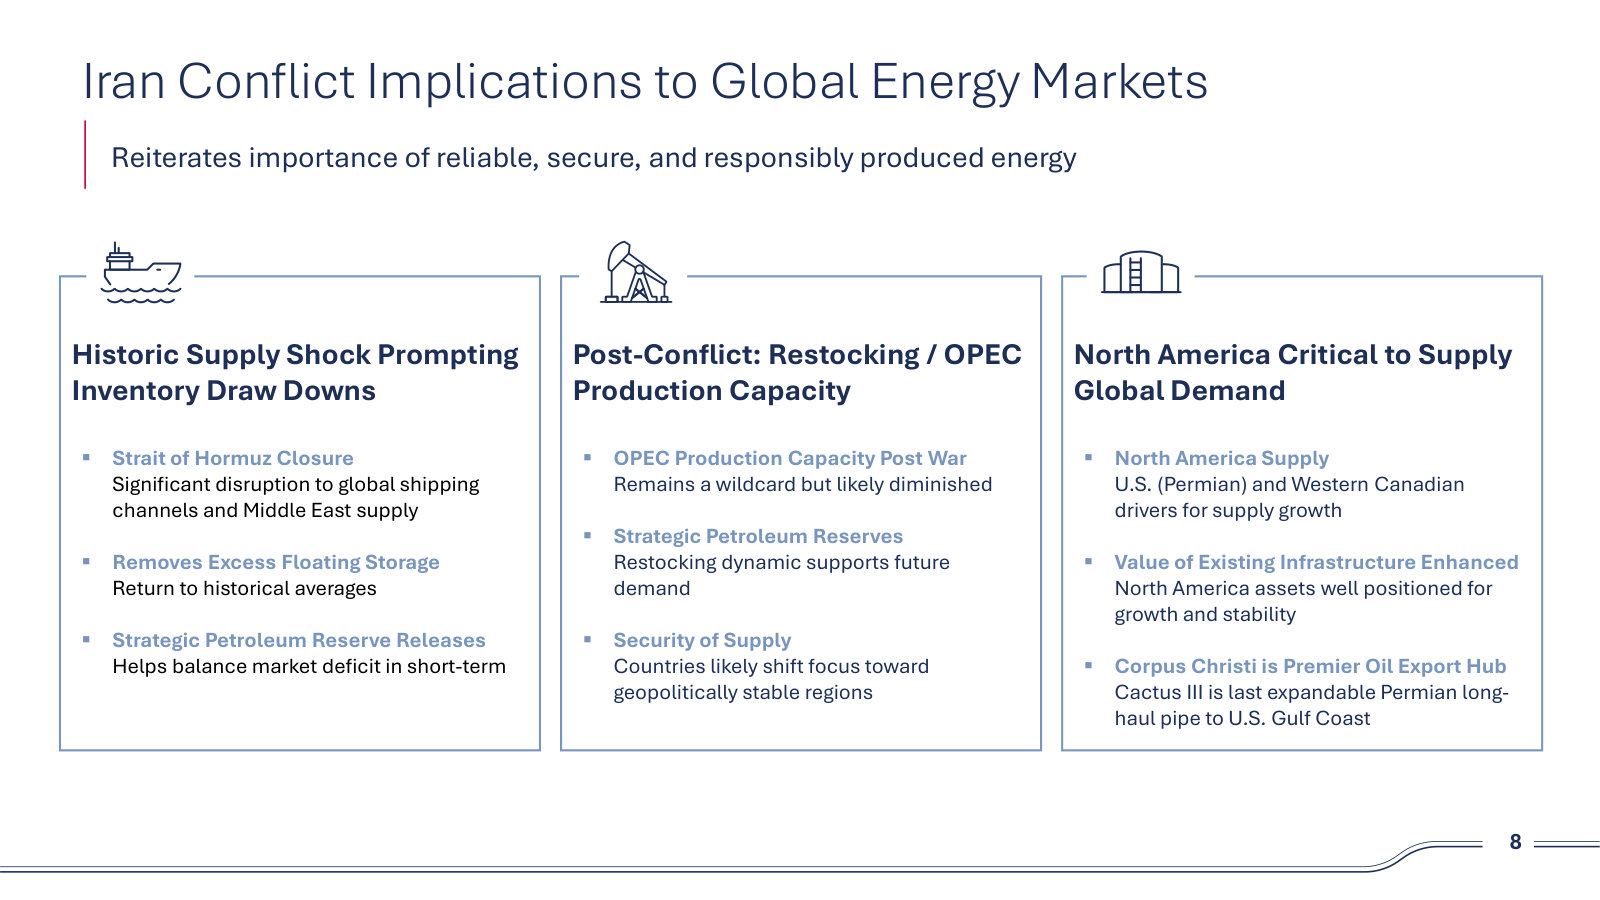
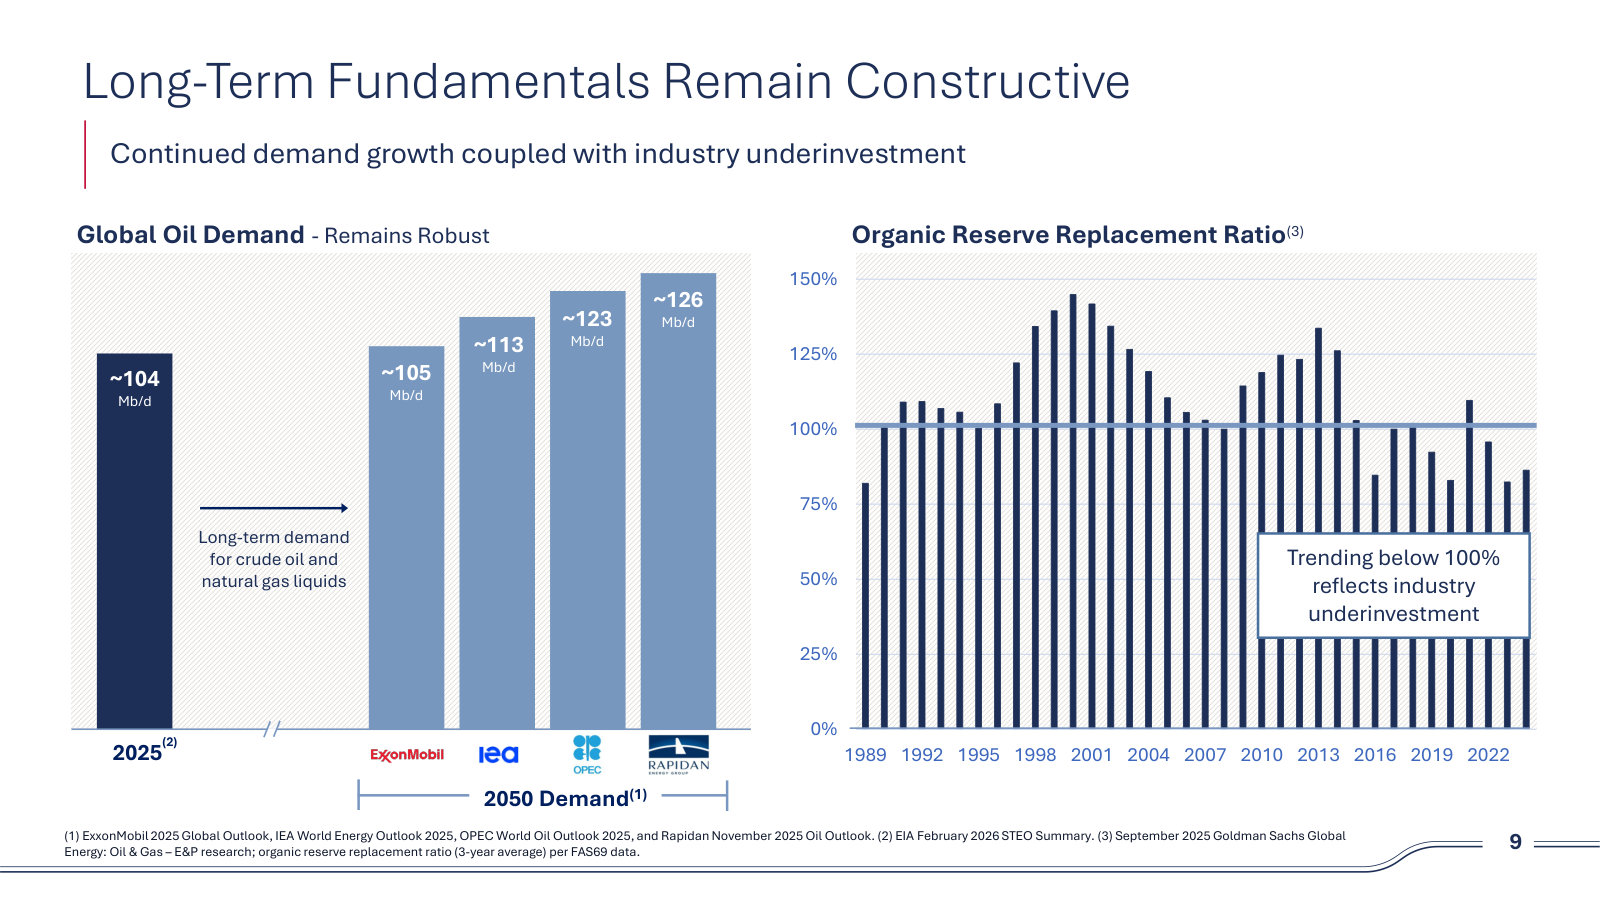
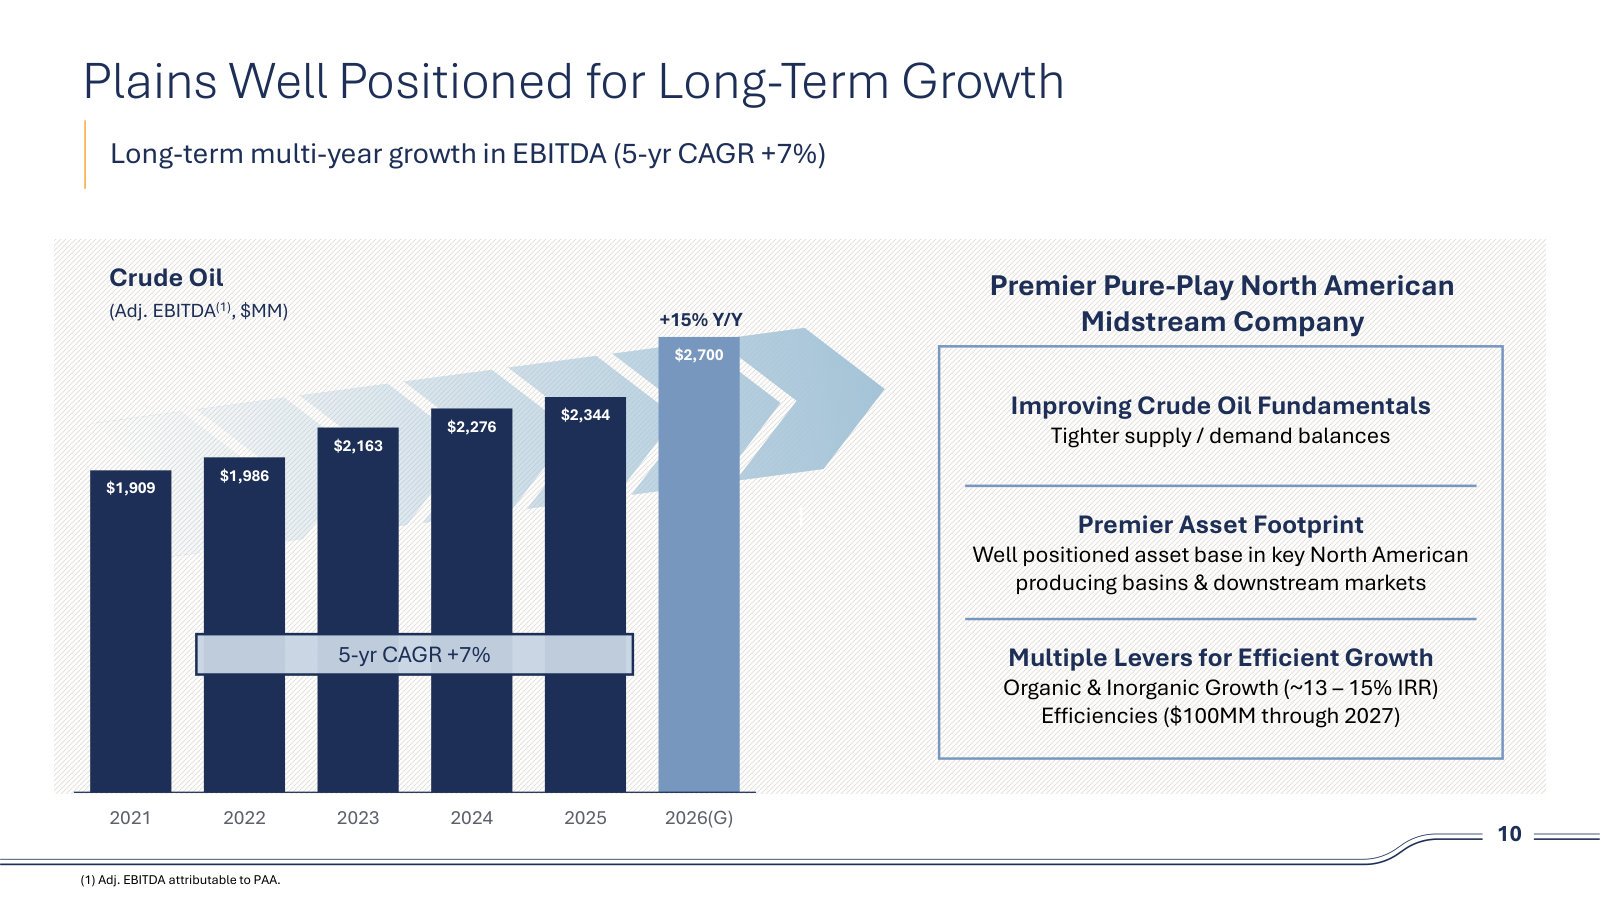
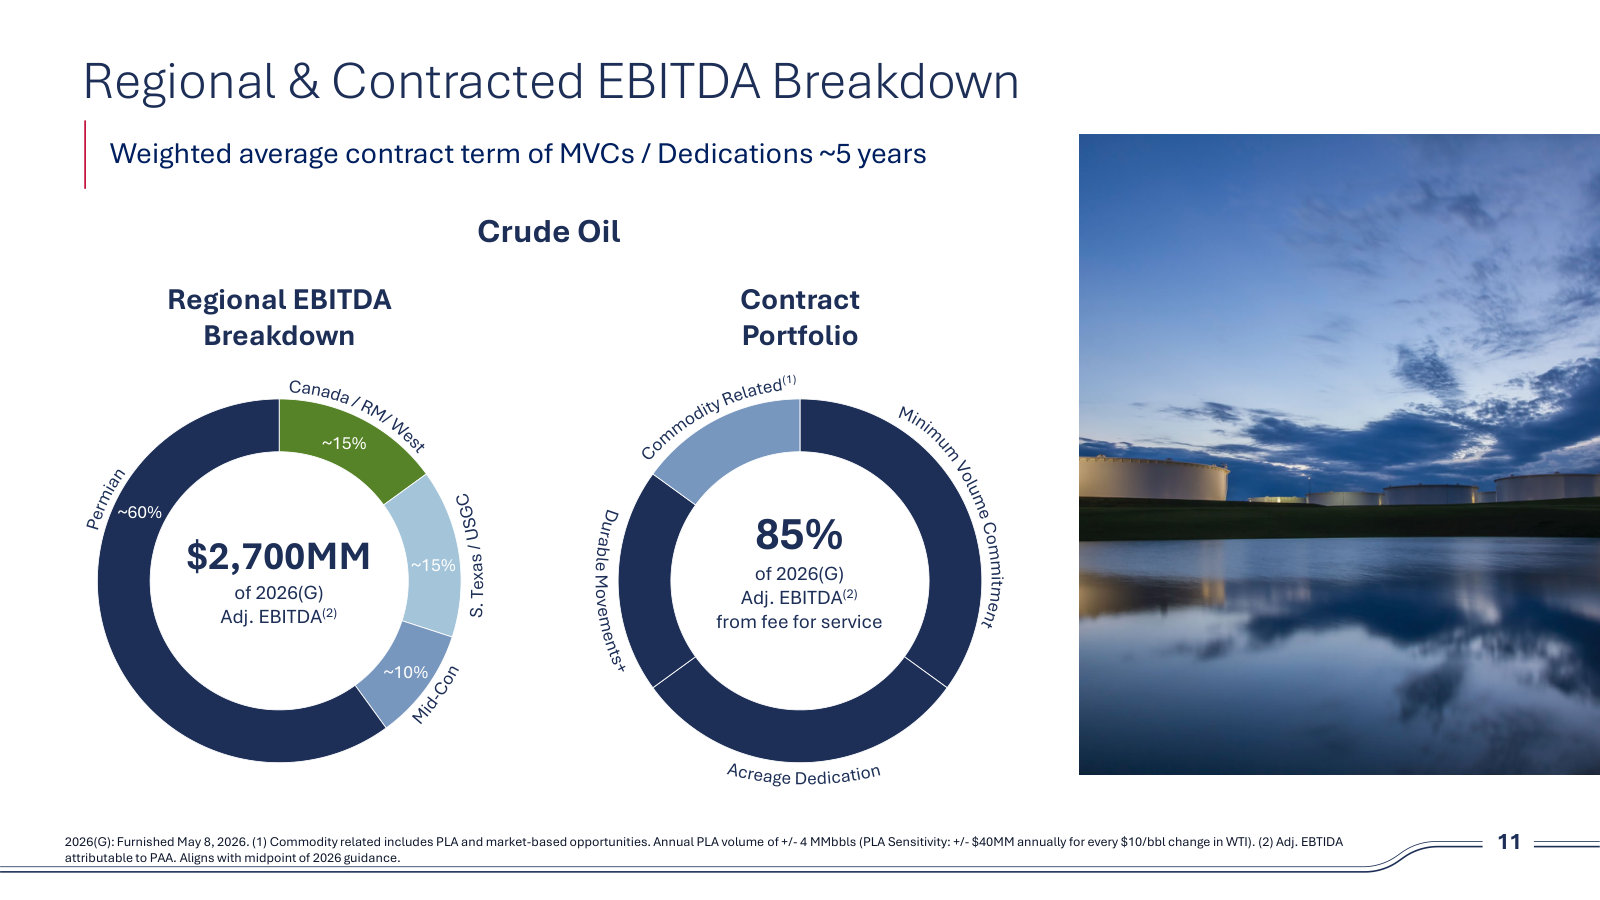
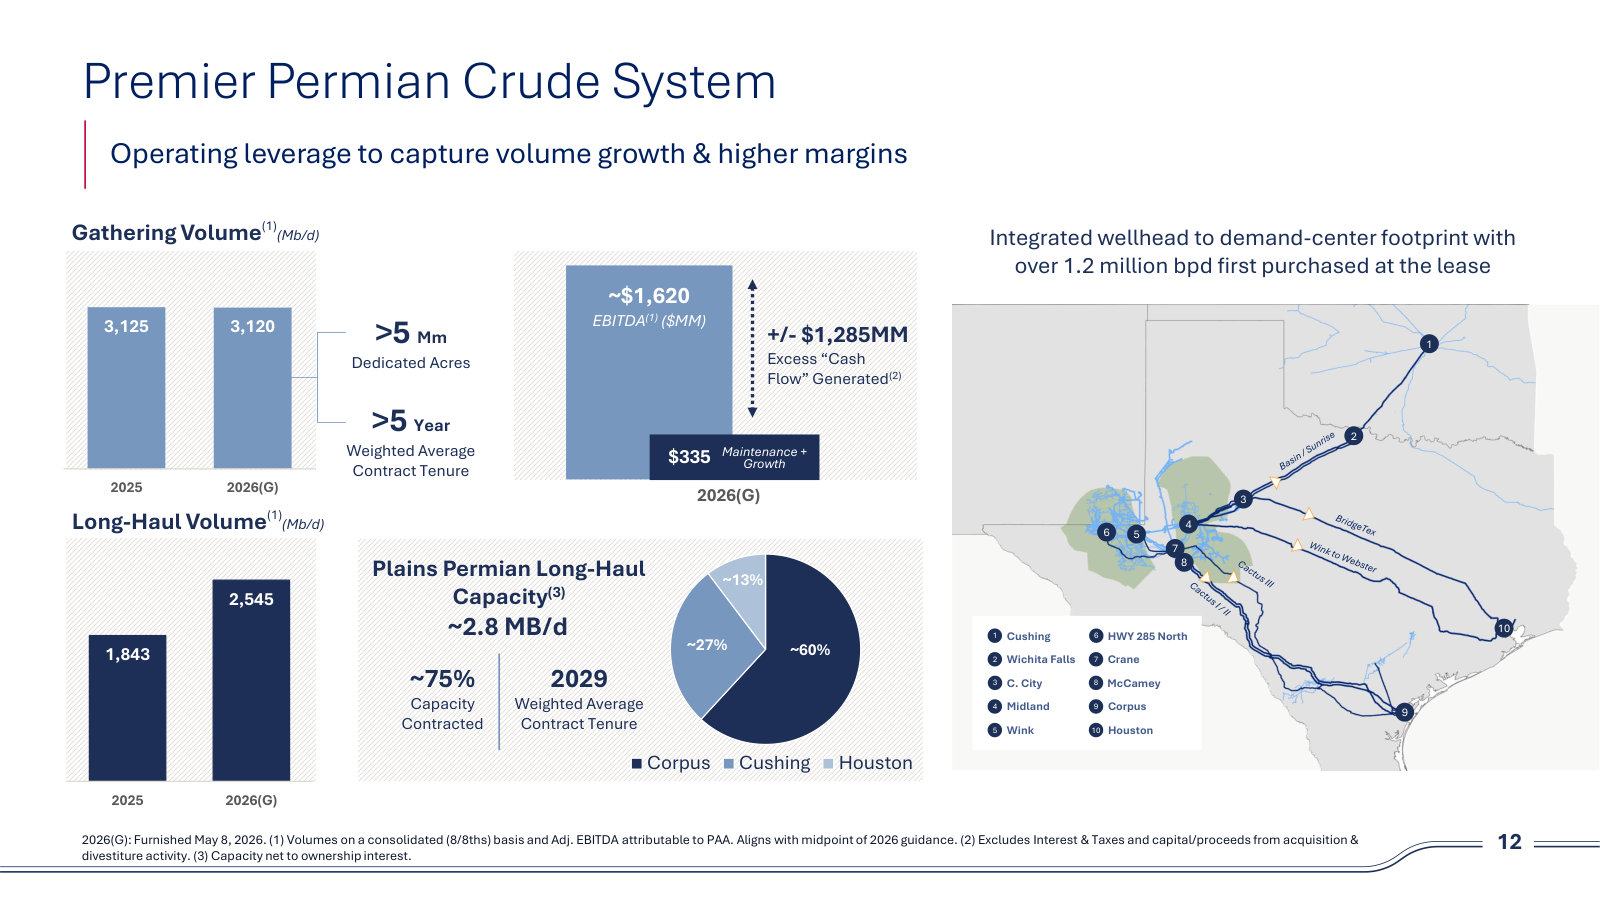
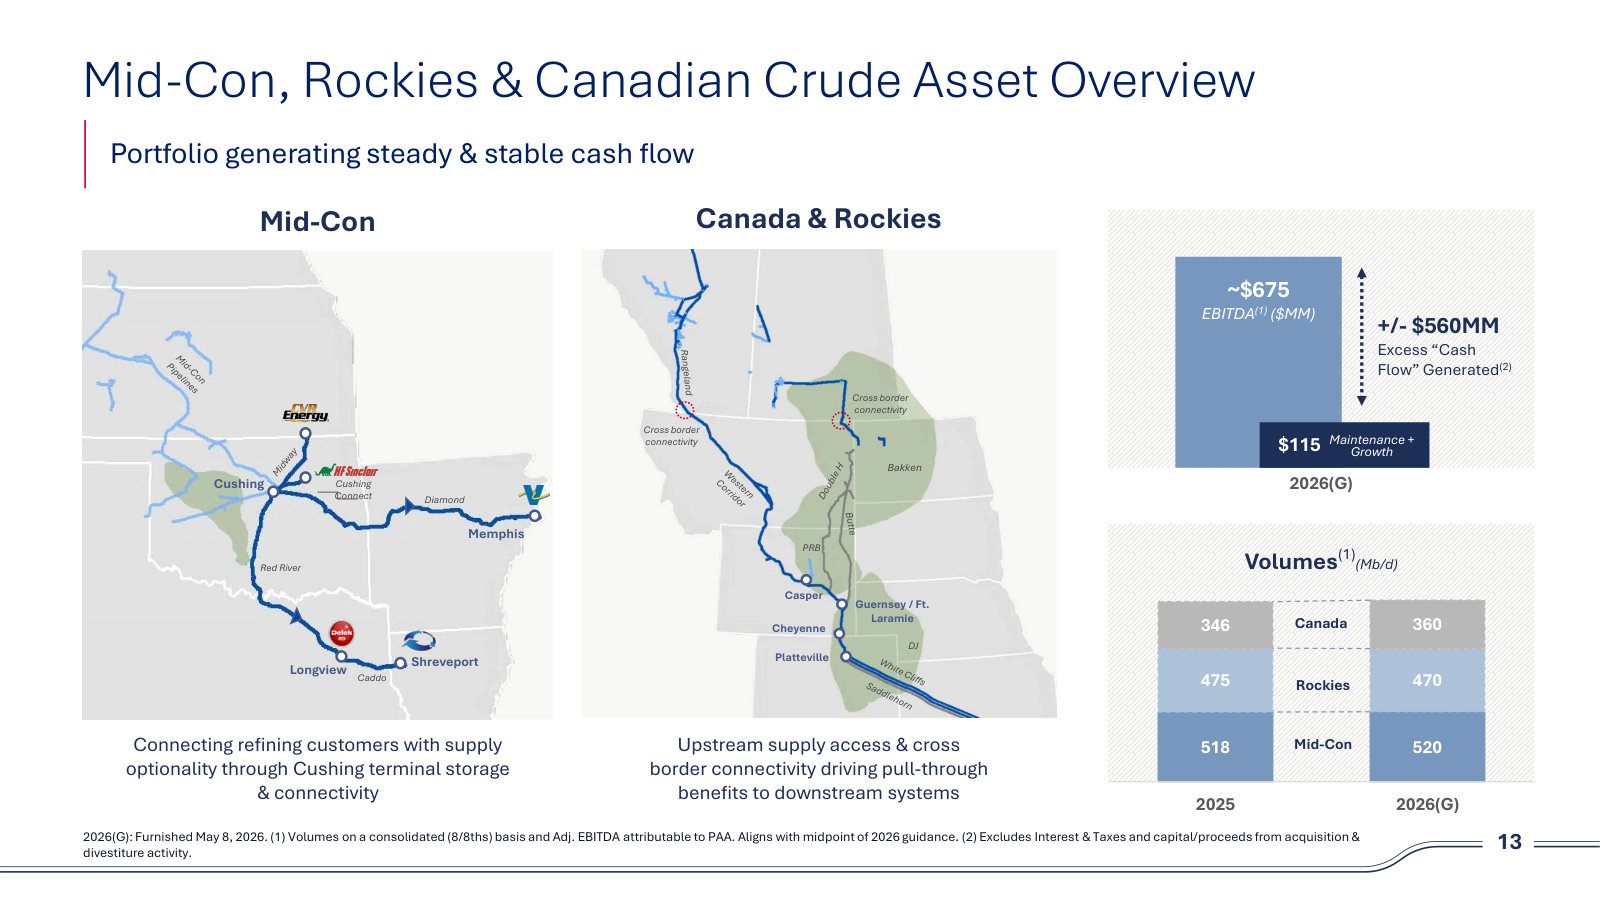
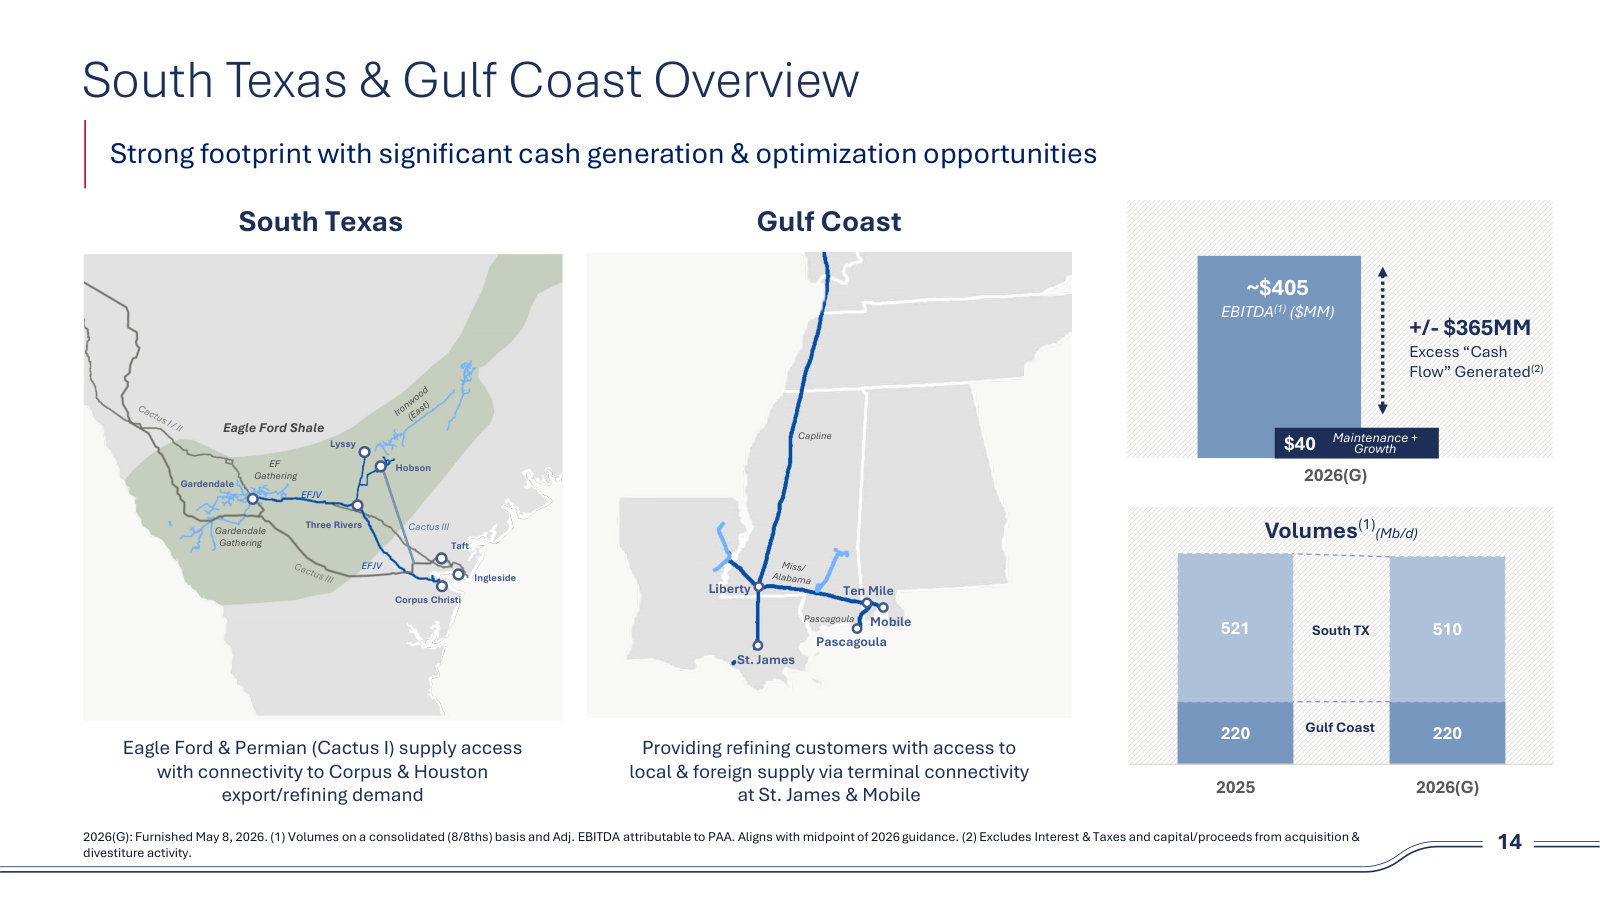
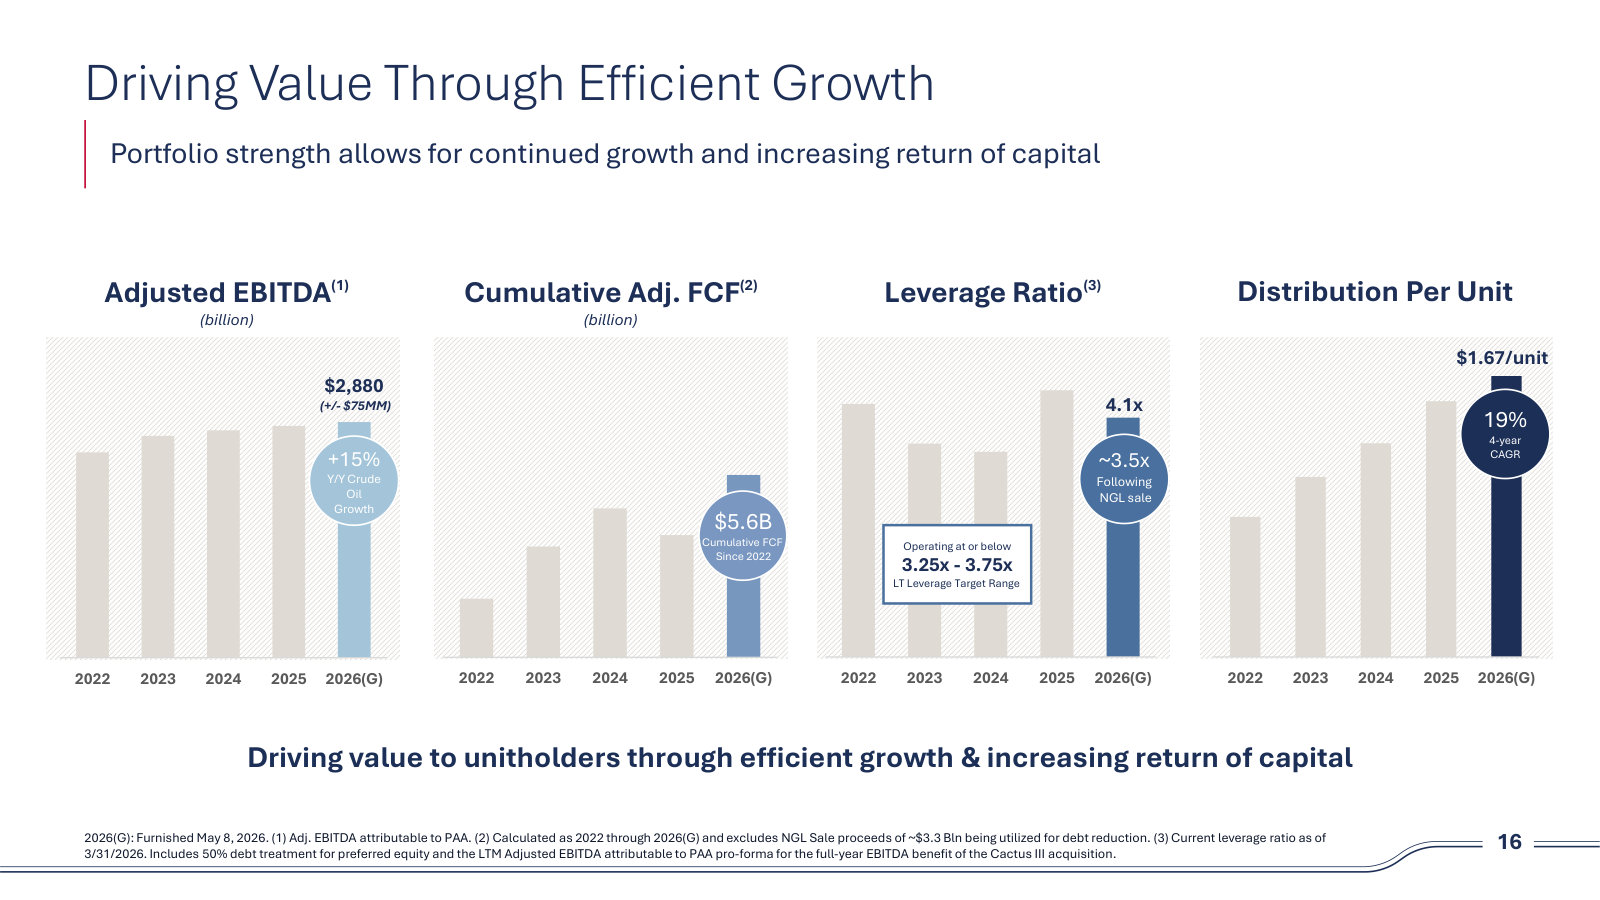
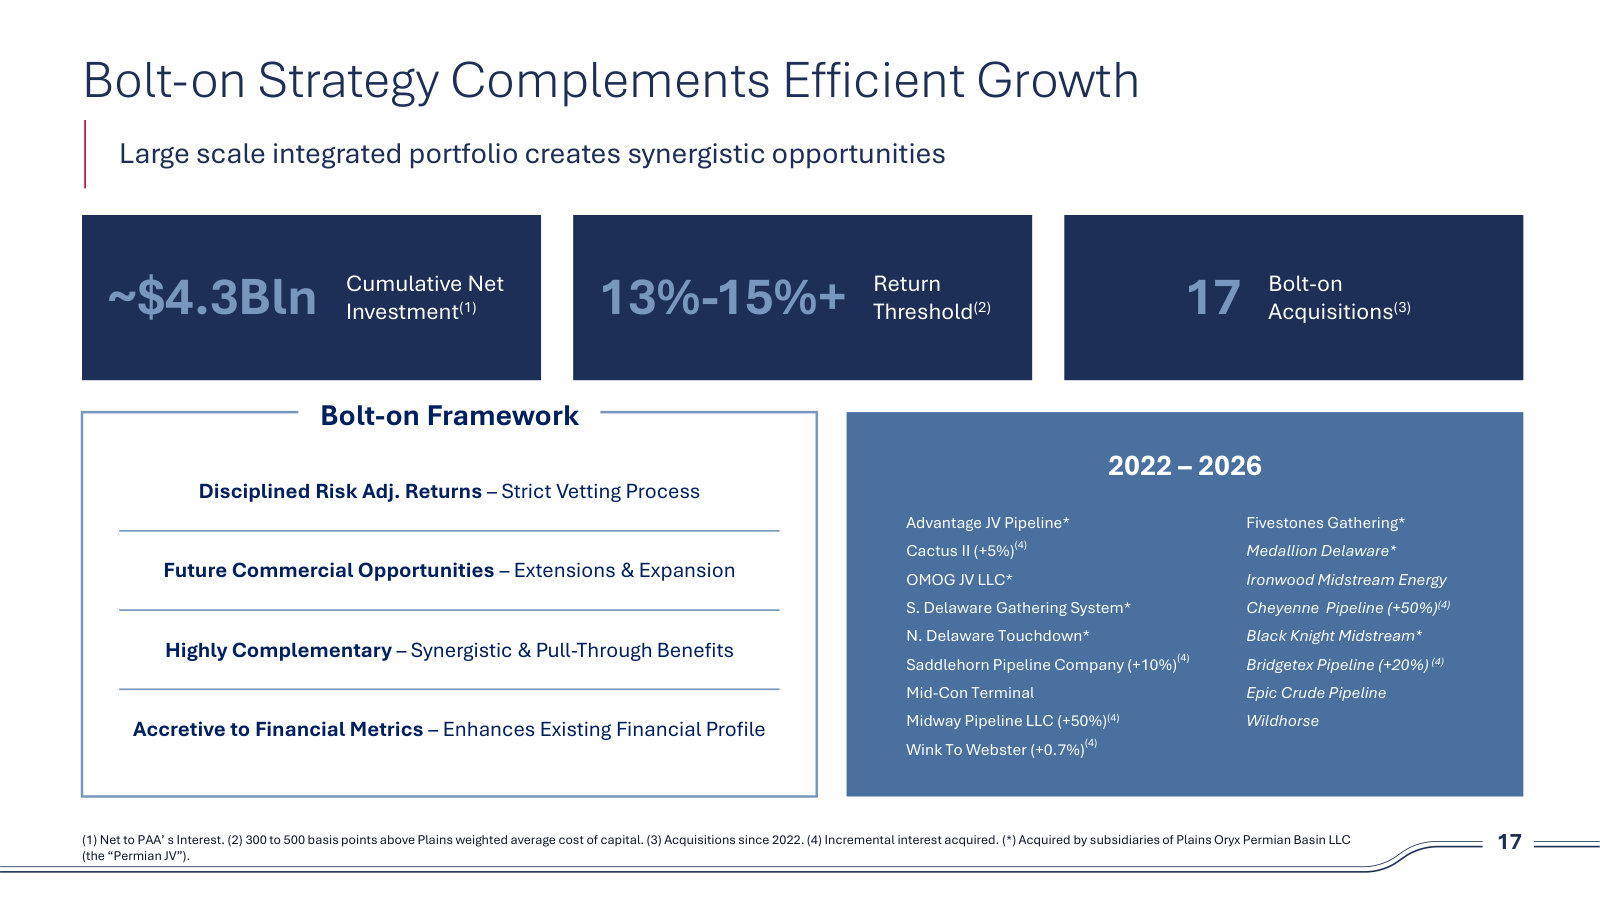
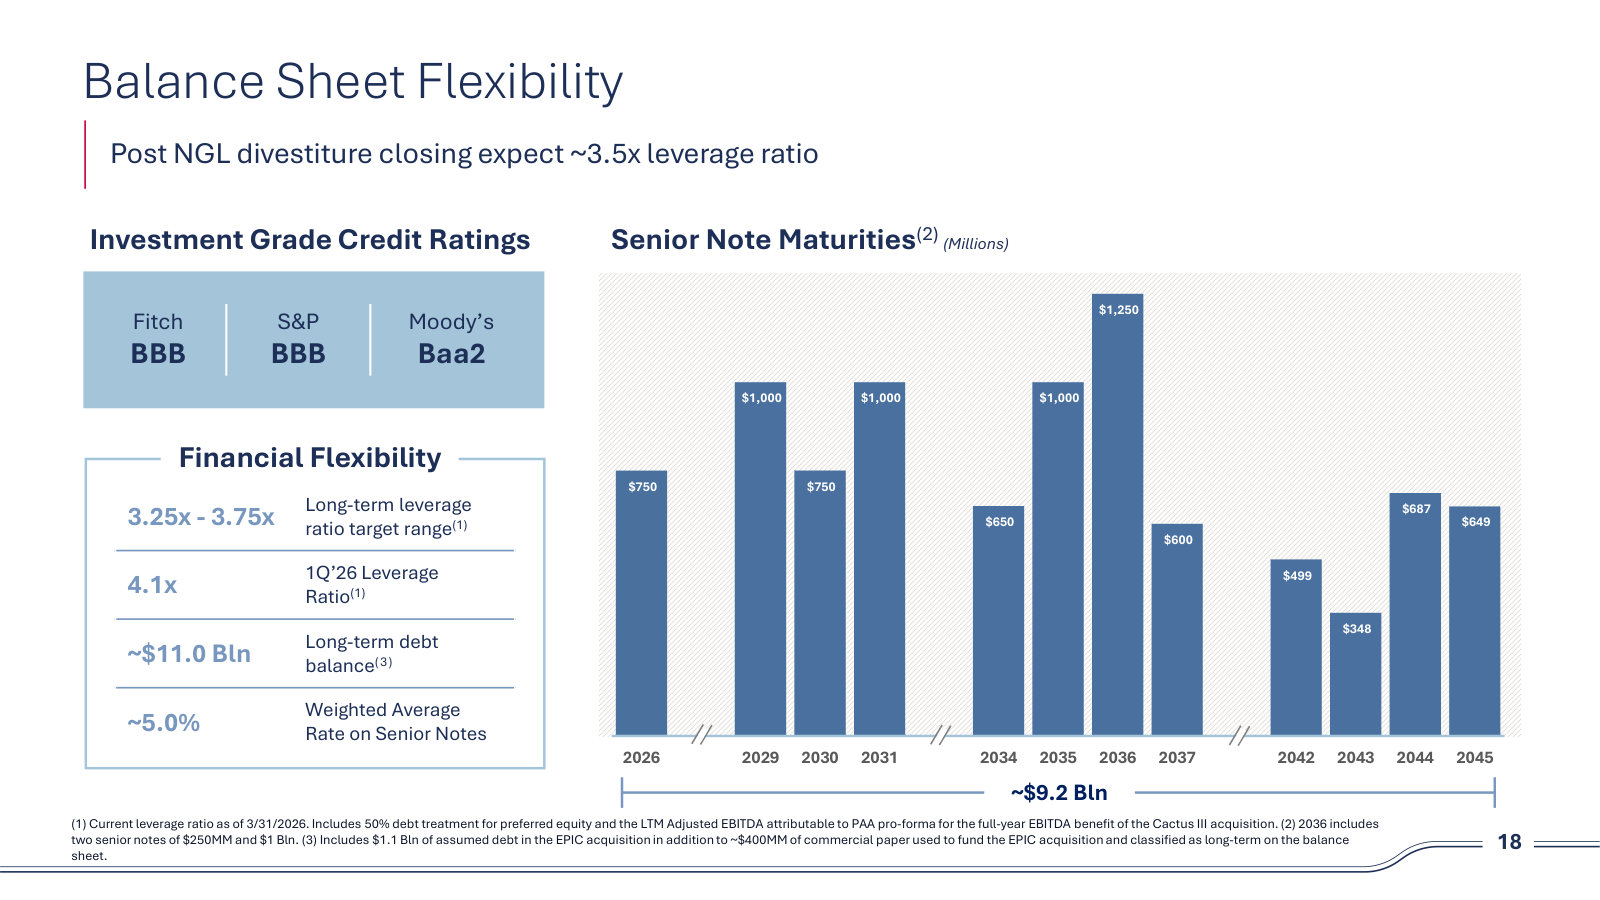
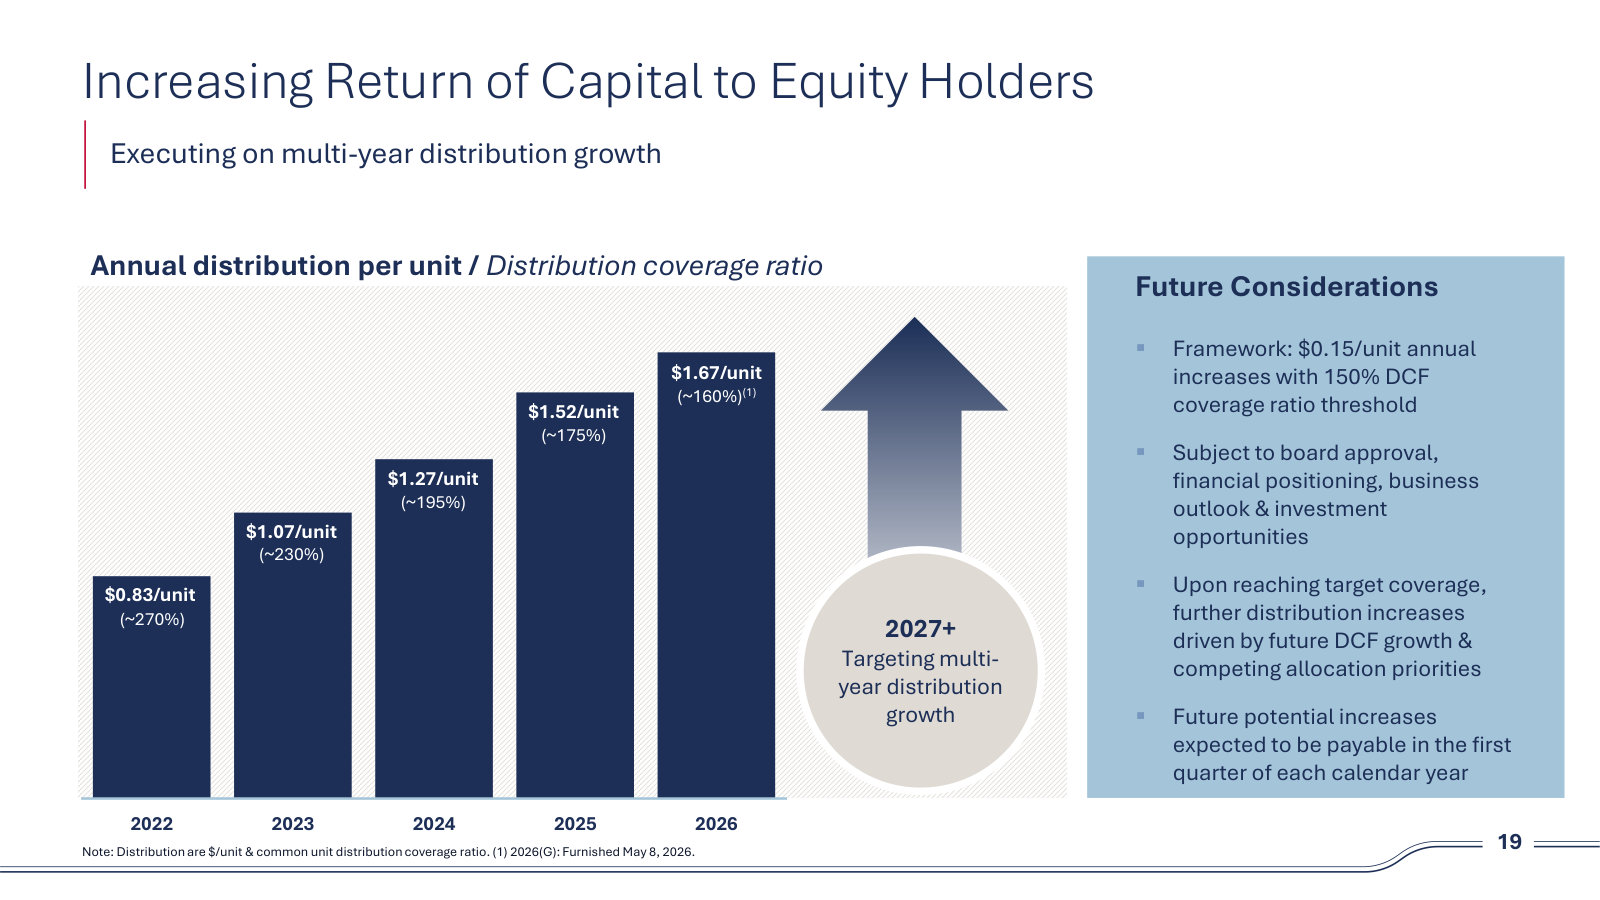
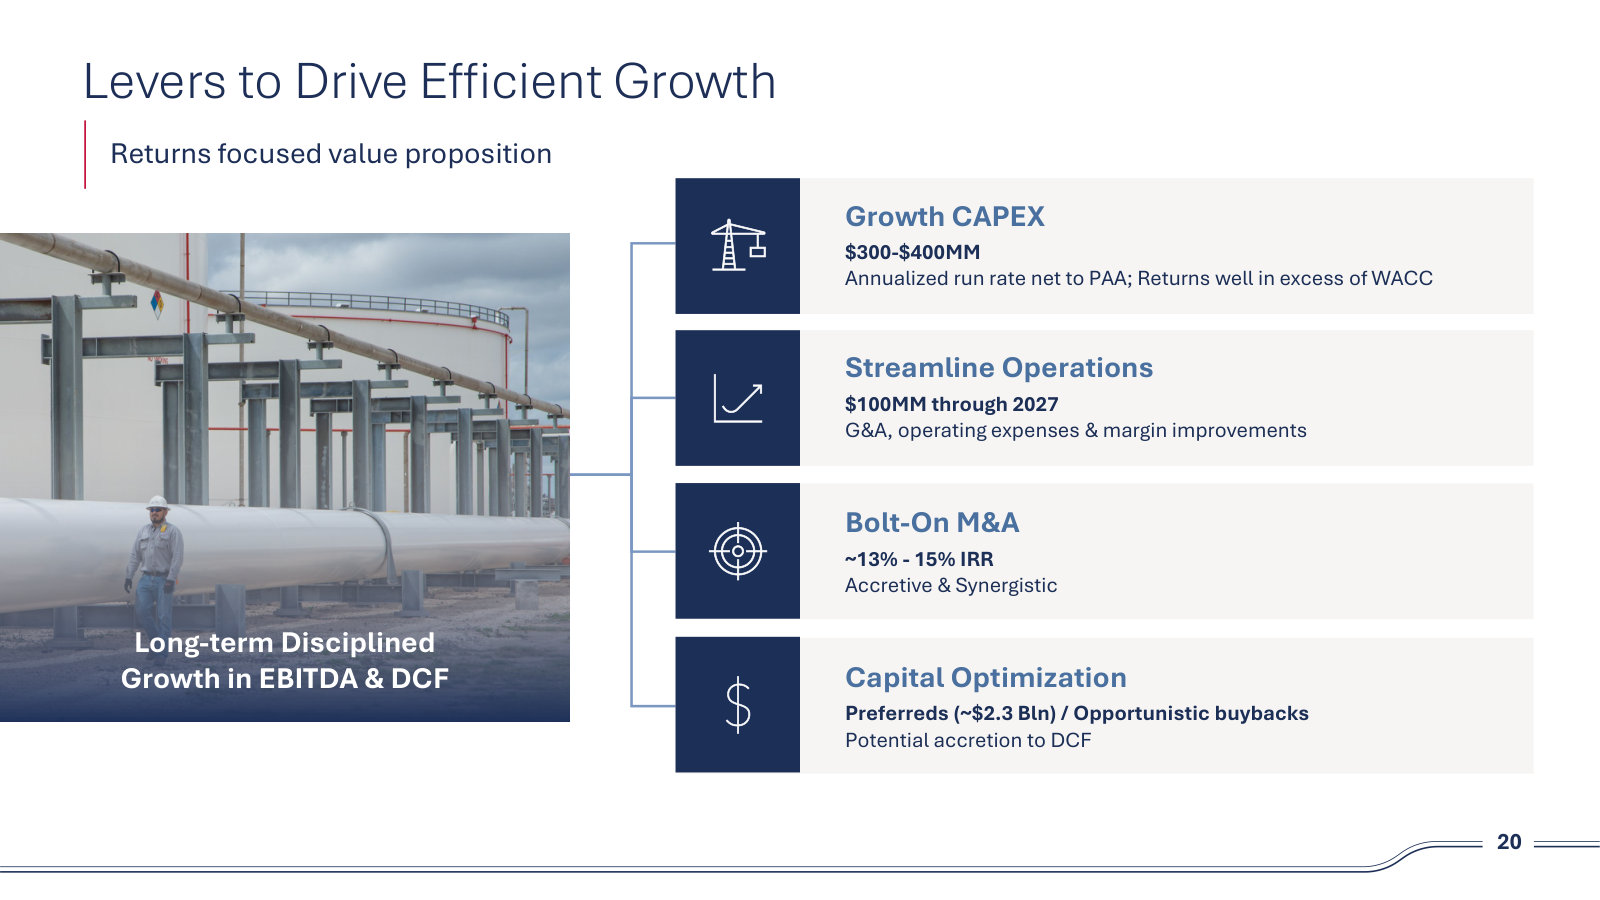
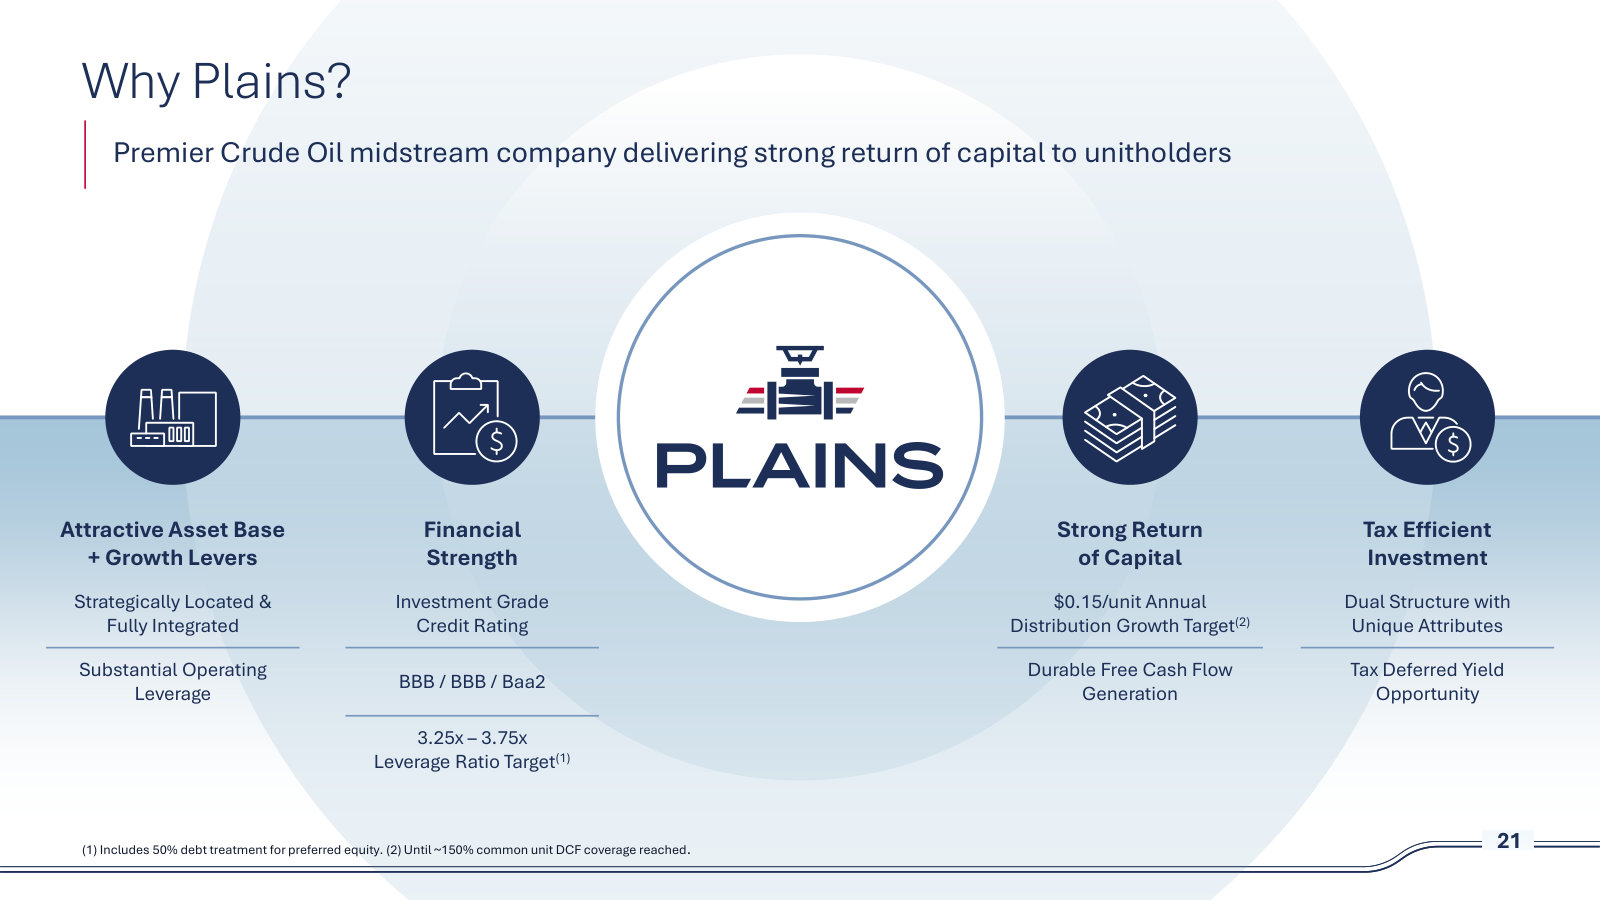
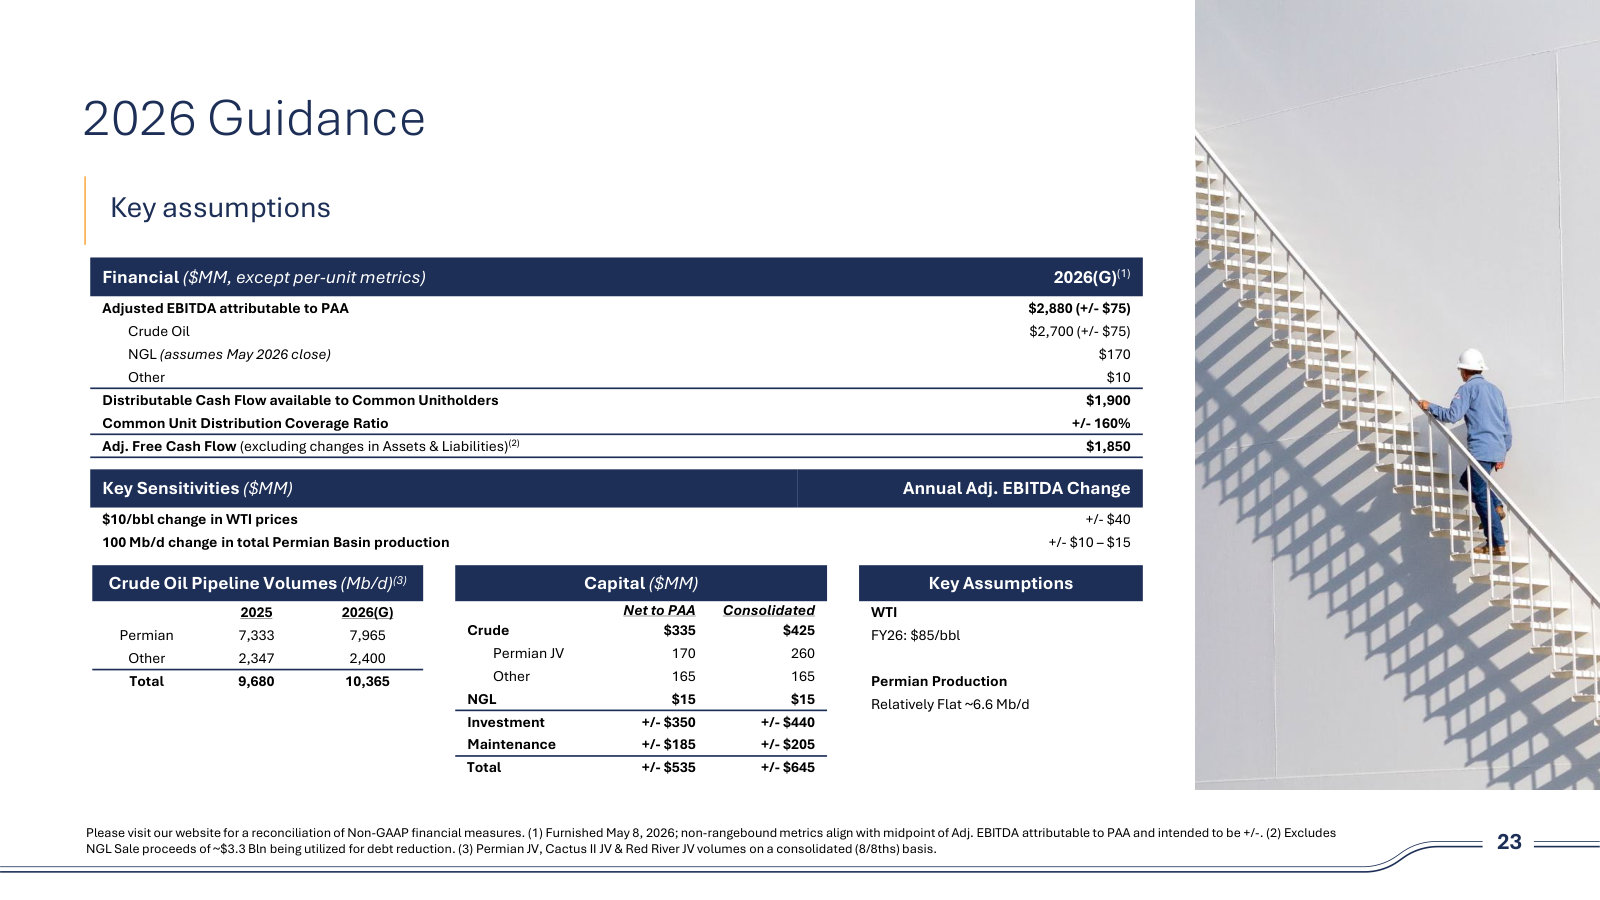
p. 3 — Scale in one page — ~$30B enterprise value, >9 MMb/d of pipeline tariff volume, and the North American asset map. · Open the full presentation →p. 4 — The PAGP/PAA structure: PAGP is a 1099 corporation owning ~28% of PAA, with a ~$1.2B deferred tax asset and no cash taxes until ~2032. · Open the full presentation →p. 5 — Why the MLP wrapper matters to a holder — pass-through, foreign tax credits, return-of-capital treatment, estate step-up. · Open the full presentation →p. 6 — The ~7.5% distribution yield set against every S&P 500 sector; this is the security's central selling point. · Open the full presentation →p. 8 — Management's read on the Iran conflict and what a supply shock means for North American infrastructure value. · Open the full presentation →p. 9 — The long-run demand case: third-party 2050 demand forecasts alongside a reserve replacement ratio below 100%. · Open the full presentation →p. 10 — Crude Oil Adjusted EBITDA 2021–2026(G) — a 7% five-year CAGR and the pure-play framing after the NGL sale. · Open the full presentation →p. 11 — Where the $2,700MM of 2026 crude EBITDA comes from: ~60% Permian, and 85% fee-for-service with ~5-year contract tenure. · Open the full presentation →p. 12 — The Permian system — gathering vs. long-haul volumes, ~2.8 MMb/d of takeaway, and $1,285MM of excess cash flow off $335MM of capital. · Open the full presentation →p. 13 — Mid-Con, Rockies and Canada: the steady-cash-flow half of the portfolio, with maps, volumes and segment EBITDA. · Open the full presentation →p. 14 — South Texas and the Gulf Coast — Eagle Ford supply into Corpus and Houston export demand, plus St. James and Mobile terminals. · Open the full presentation →p. 16 — Four bars that summarize the equity story: EBITDA, cumulative FCF, leverage and distribution per unit, 2022 through 2026(G). · Open the full presentation →p. 17 — The bolt-on machine — 17 acquisitions, ~$4.3B invested since 2022 at a 13–15%+ return threshold, and the vetting framework. · Open the full presentation →p. 18 — Balance sheet: BBB/BBB/Baa2, the 3.25x–3.75x leverage target against 4.1x today, and the senior note maturity ladder. · Open the full presentation →p. 19 — Distribution per unit from $0.83 to $1.67 with coverage falling from ~270% to ~160% — the return-of-capital policy in one chart. · Open the full presentation →p. 20 — The four levers management says drive growth: growth capex, $100MM of cost savings, bolt-on M&A and capital optimization. · Open the full presentation →p. 21 — Management's own four-part summary of the investment case, useful as a checklist against the rest of the report. · Open the full presentation →p. 23 — Full 2026 guidance with sensitivities — $40MM of EBITDA per $10/bbl of WTI, and the capital budget split net vs. consolidated. · Open the full presentation →
The most recent quarterly deck: current results, the raised 2026 guidance and the segment-level volume and EBITDA history. · Open the full document →
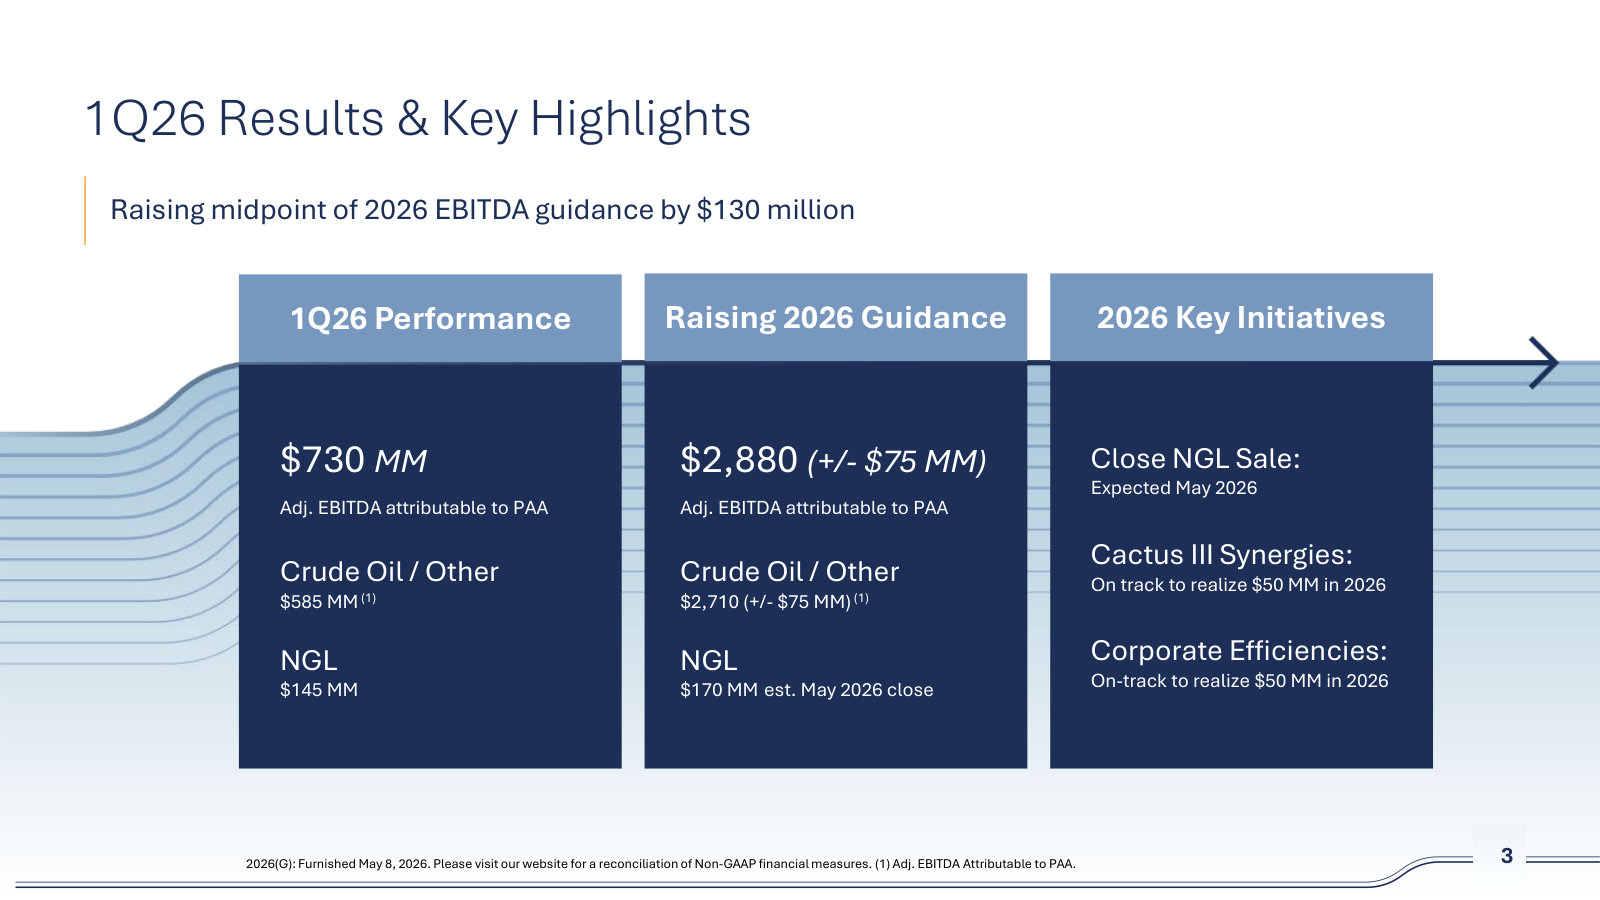
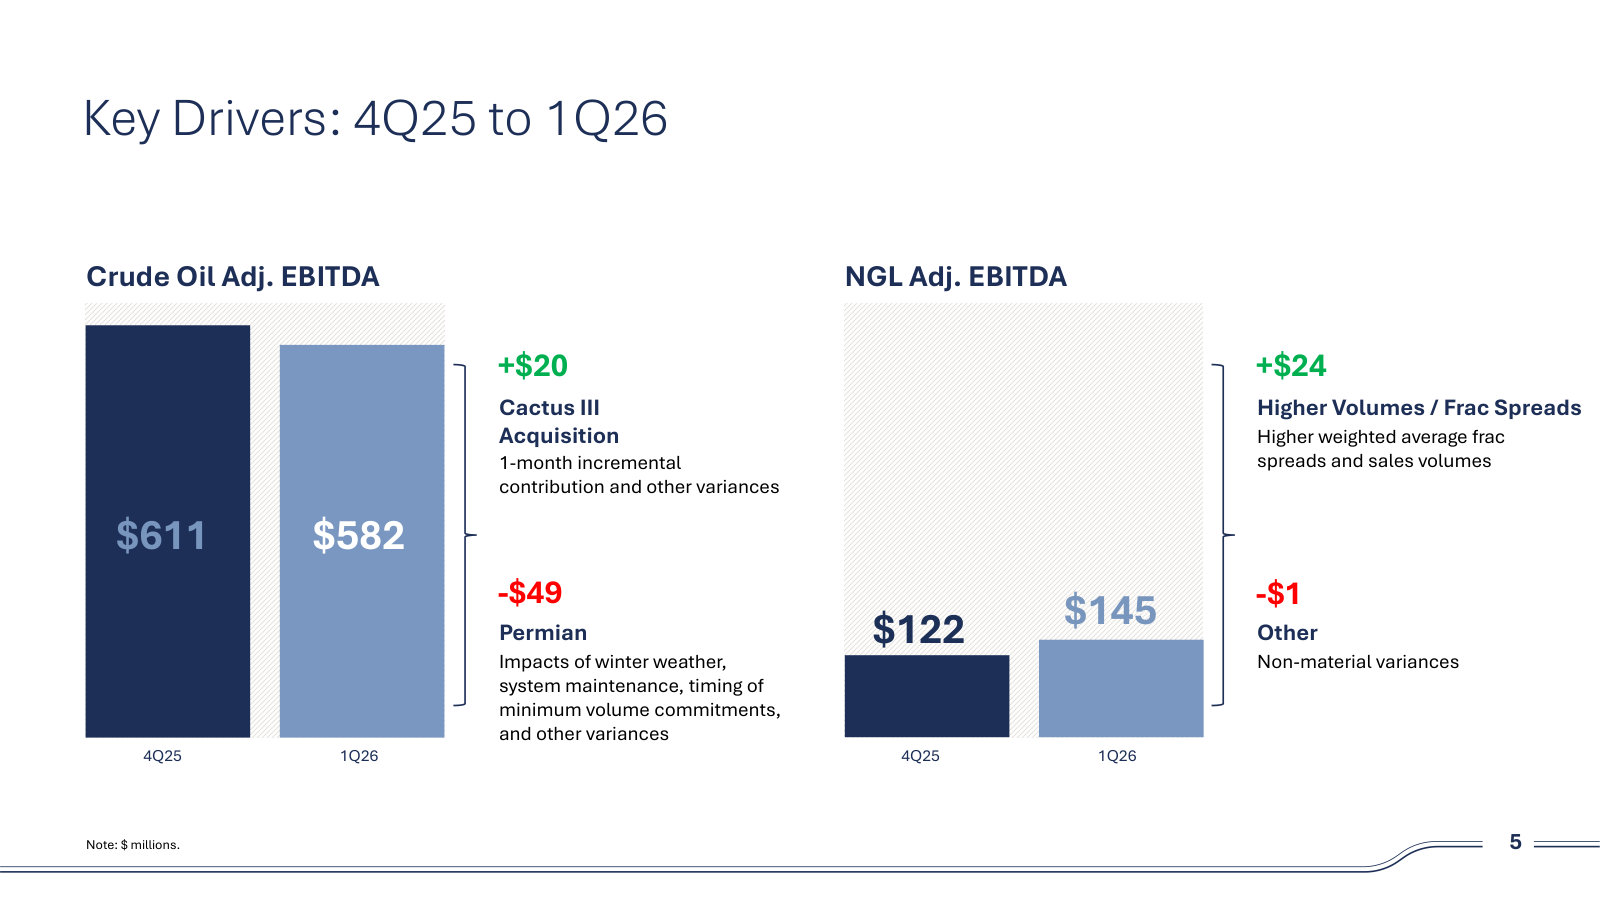
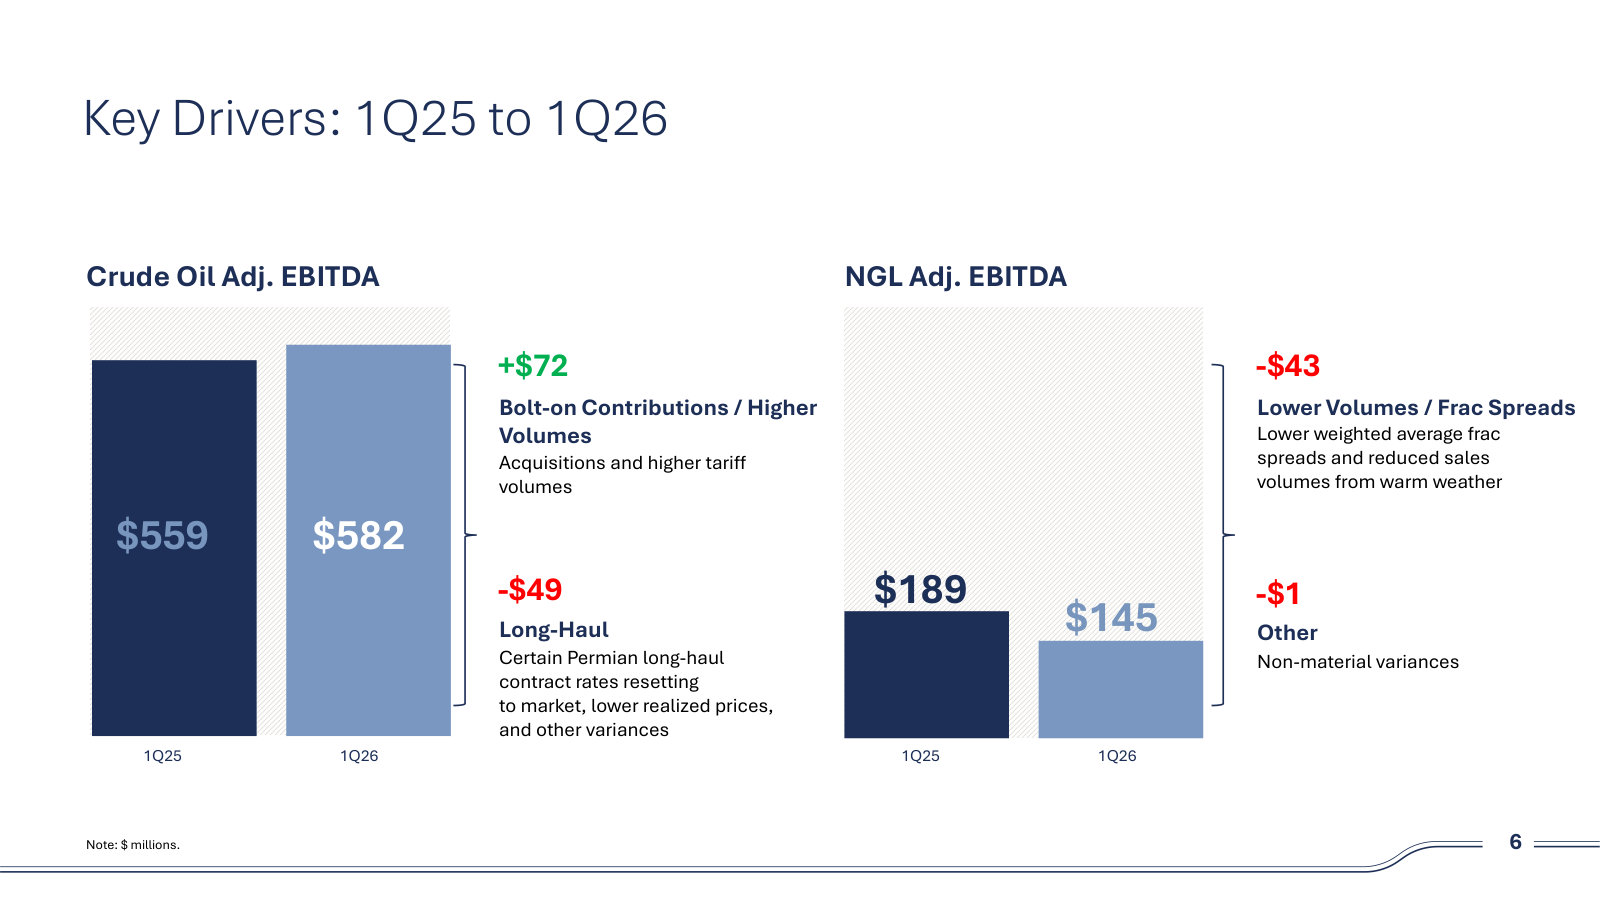
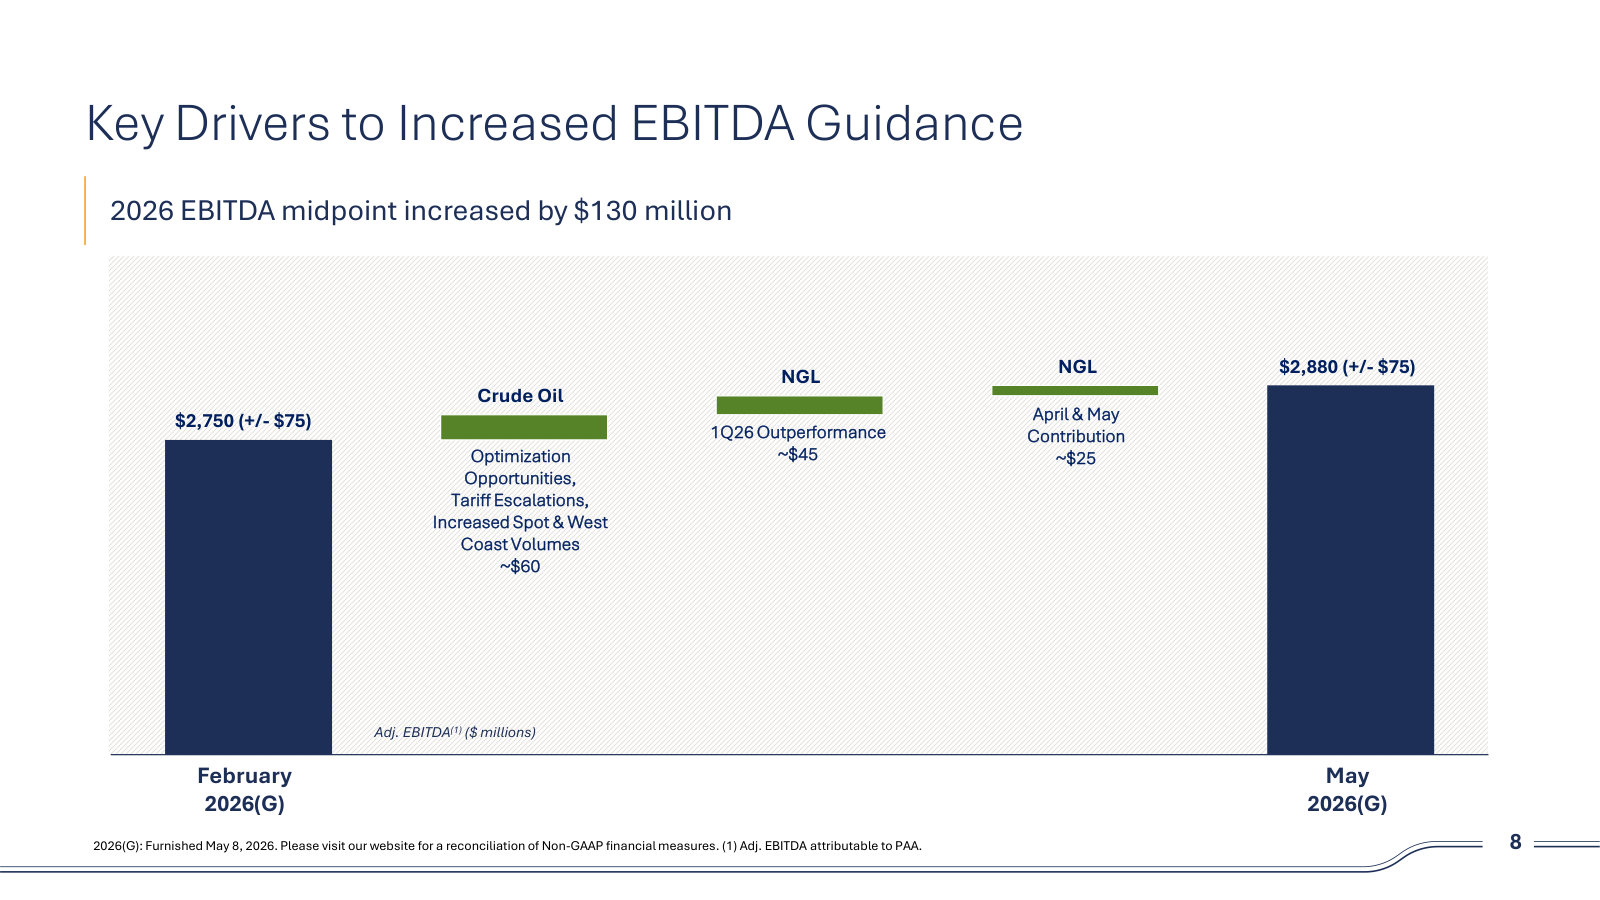
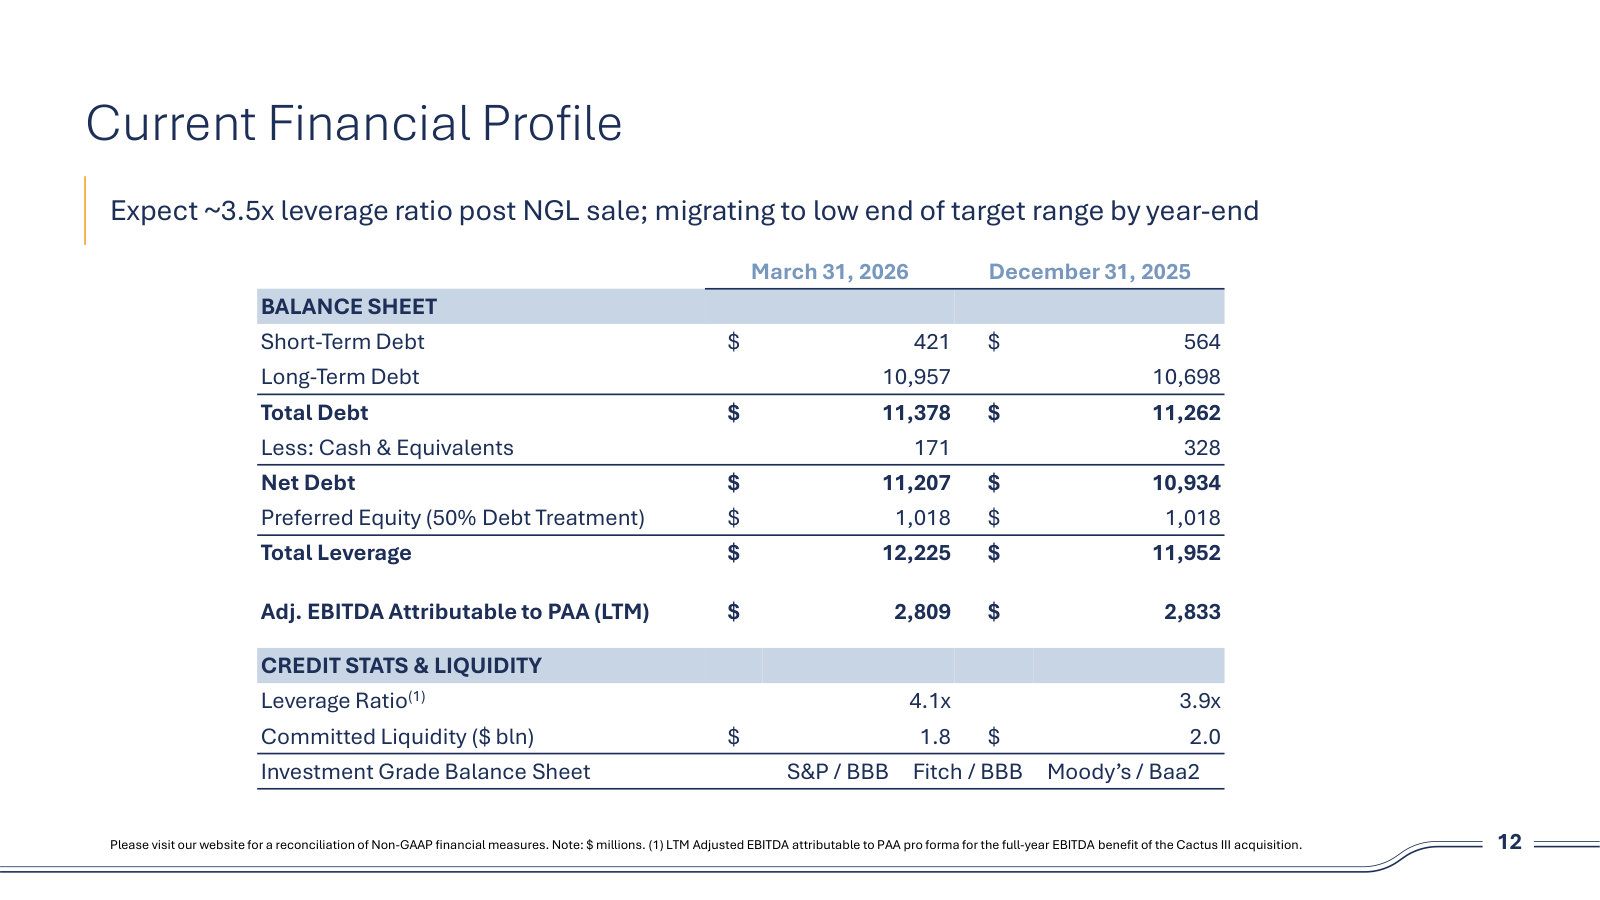
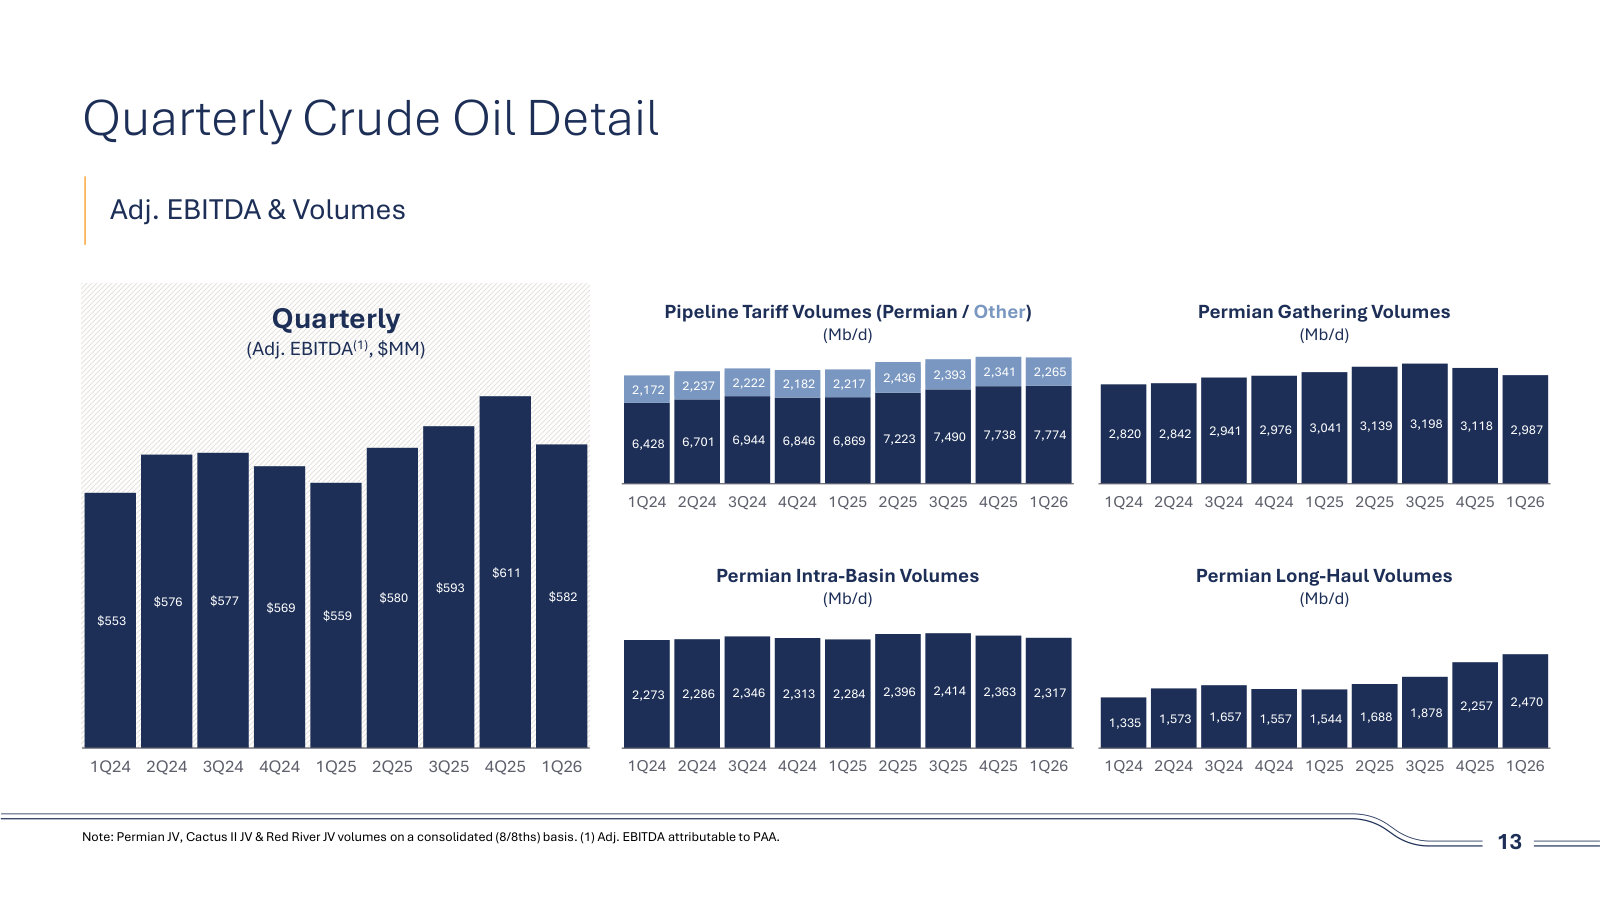
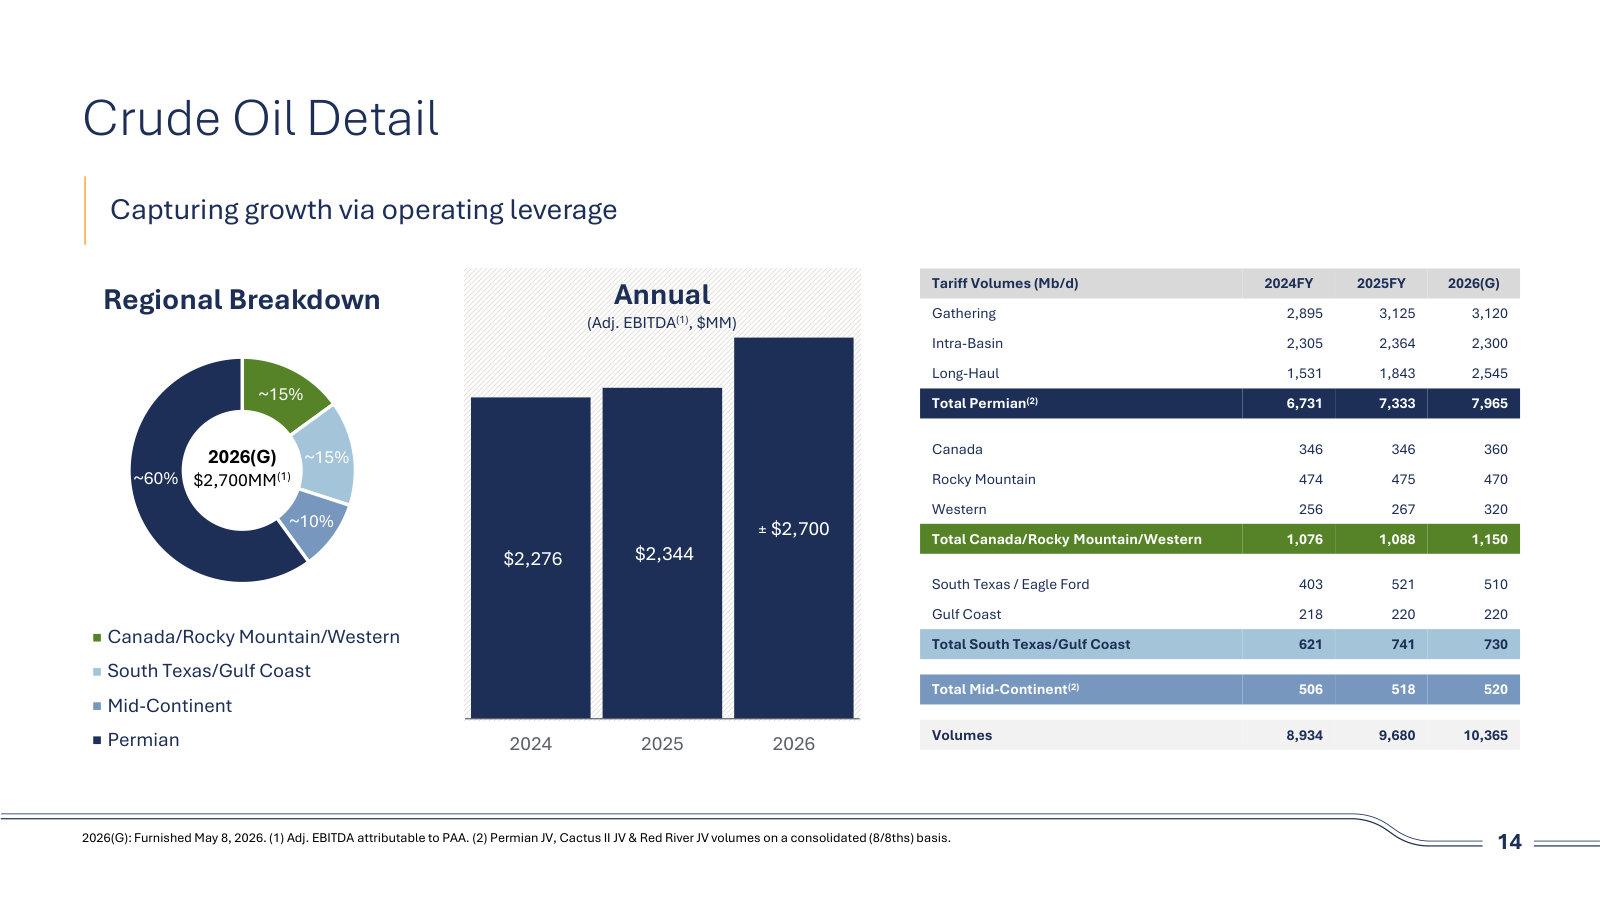
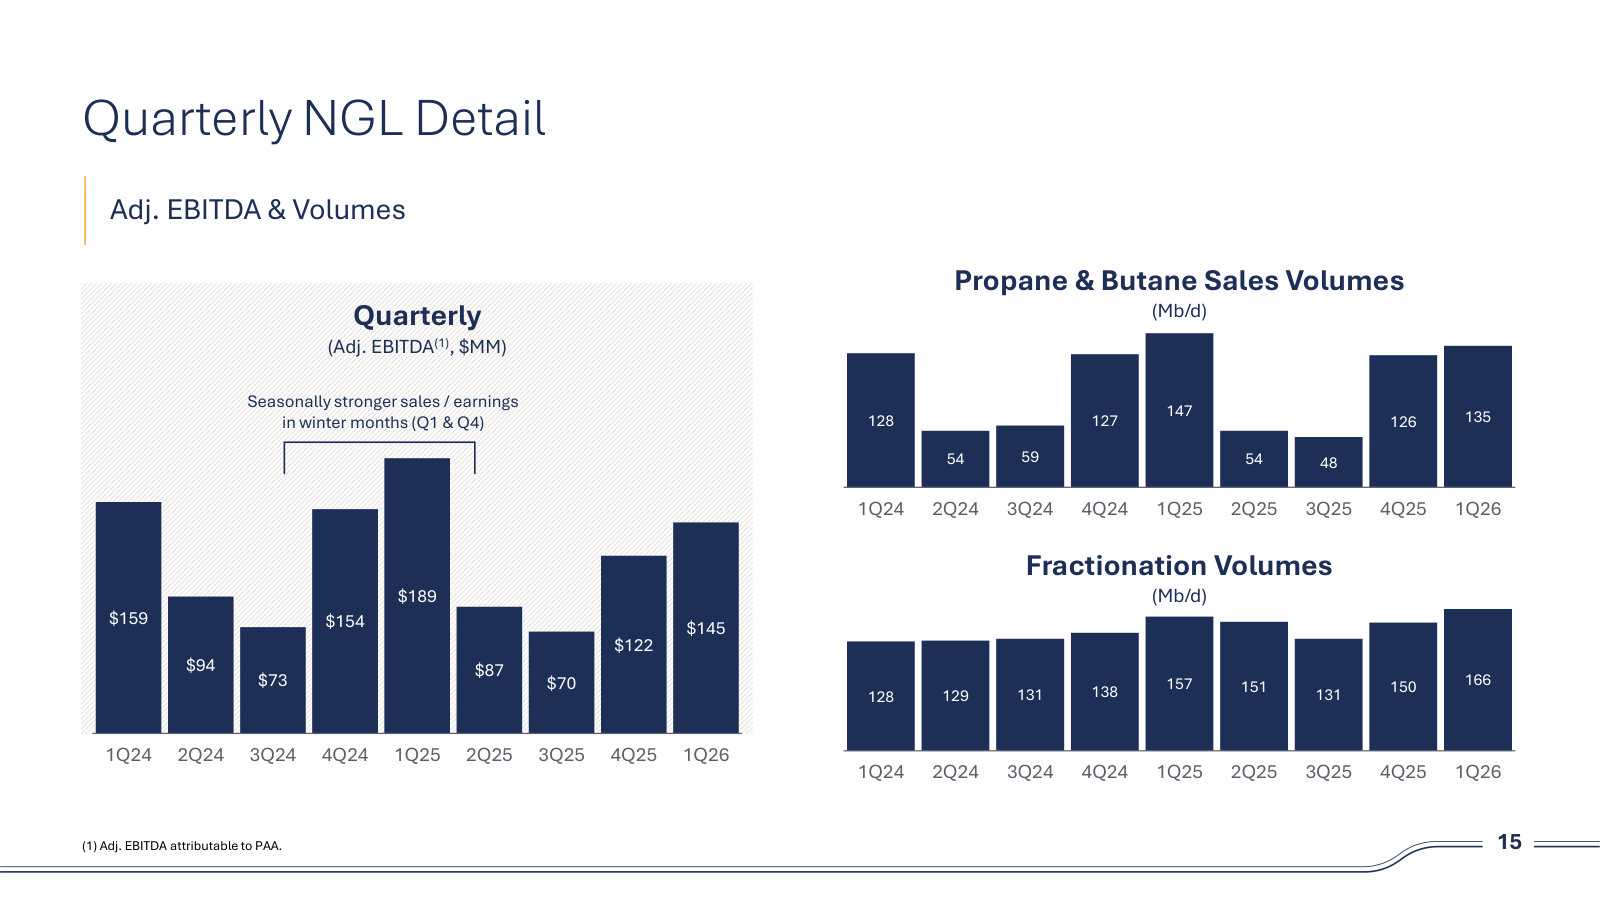
p. 3 — 1Q26 in one page — $730MM of EBITDA, guidance raised $130MM, and the three 2026 initiatives management is tracking. · Open the full presentation →p. 5 — Sequential bridge: Cactus III adds $20MM while winter weather and maintenance take $49MM out of the Permian. · Open the full presentation →p. 6 — Year-over-year bridge showing the offsetting forces — bolt-ons add $72MM, Permian long-haul contract resets cost $49MM. · Open the full presentation →p. 8 — What changed between February and May guidance: $60MM of crude optimization plus $70MM from NGL before the sale closes. · Open the full presentation →p. 12 — The actual balance sheet — $11.4B of debt, 4.1x leverage, $1.8B of committed liquidity, against the 3.5x post-sale target. · Open the full presentation →p. 13 — Nine quarters of crude EBITDA and volumes, including the long-haul series that has climbed from 1,335 to 2,470 Mb/d. · Open the full presentation →p. 14 — Crude segment detail: regional EBITDA mix next to a full tariff-volume table by region, 2024 through 2026 guidance. · Open the full presentation →p. 15 — The NGL segment's winter seasonality — Q1/Q4 earnings roughly double Q2/Q3, which is part of why it is being sold. · Open the full presentation →
Where the 2026 plan was set out: initial guidance, the three strategic initiatives and the bridge from 2025 earnings. · Open the full document →
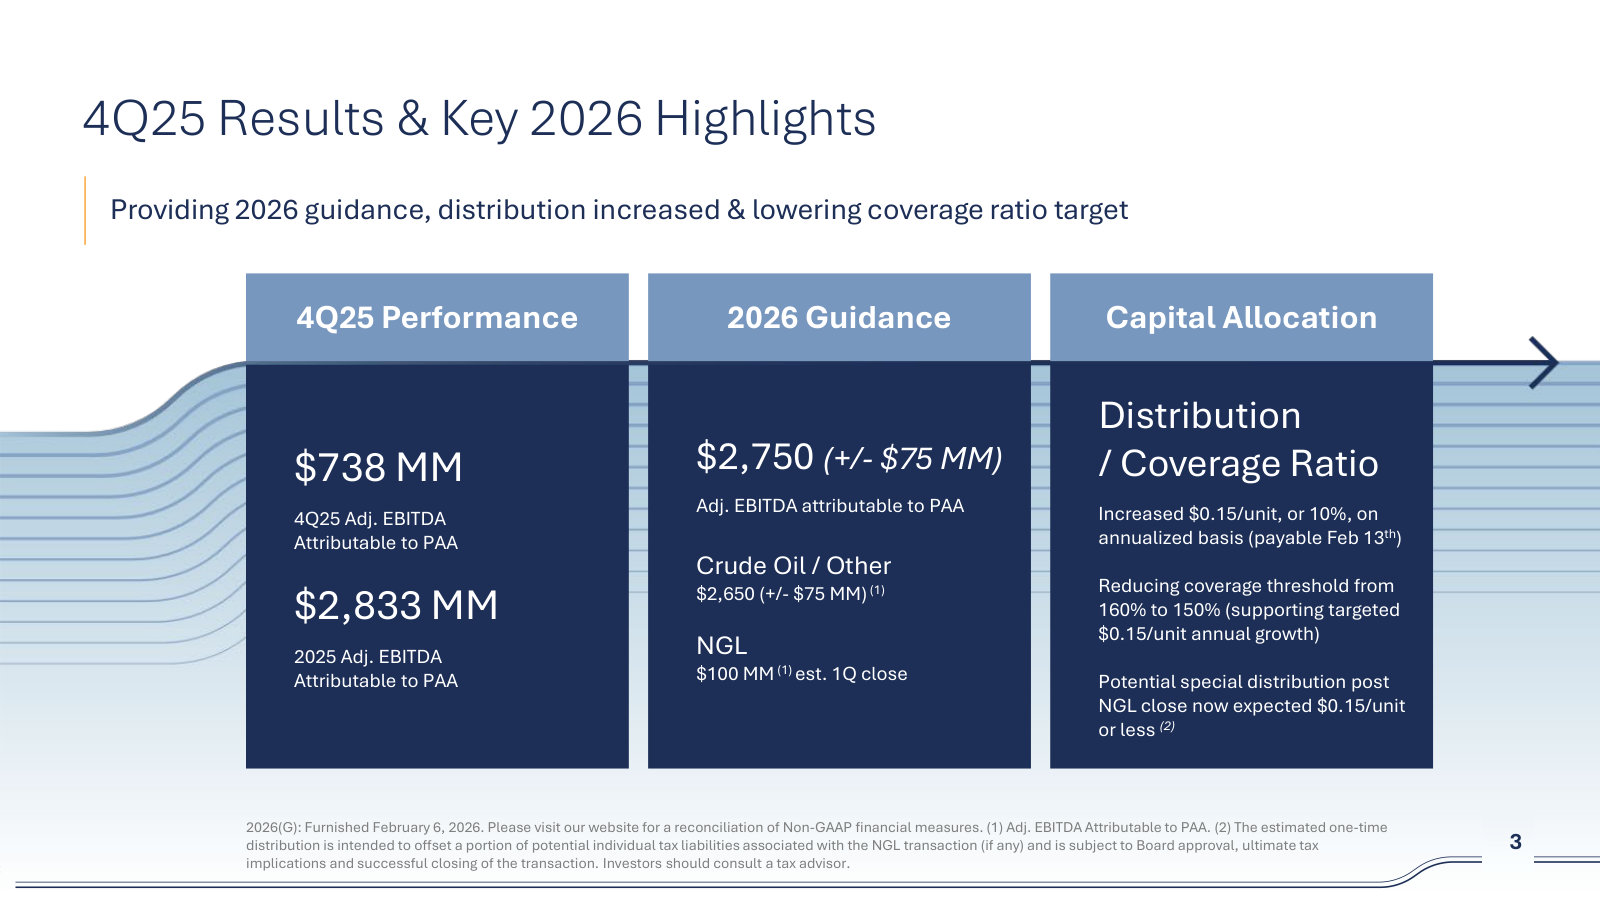
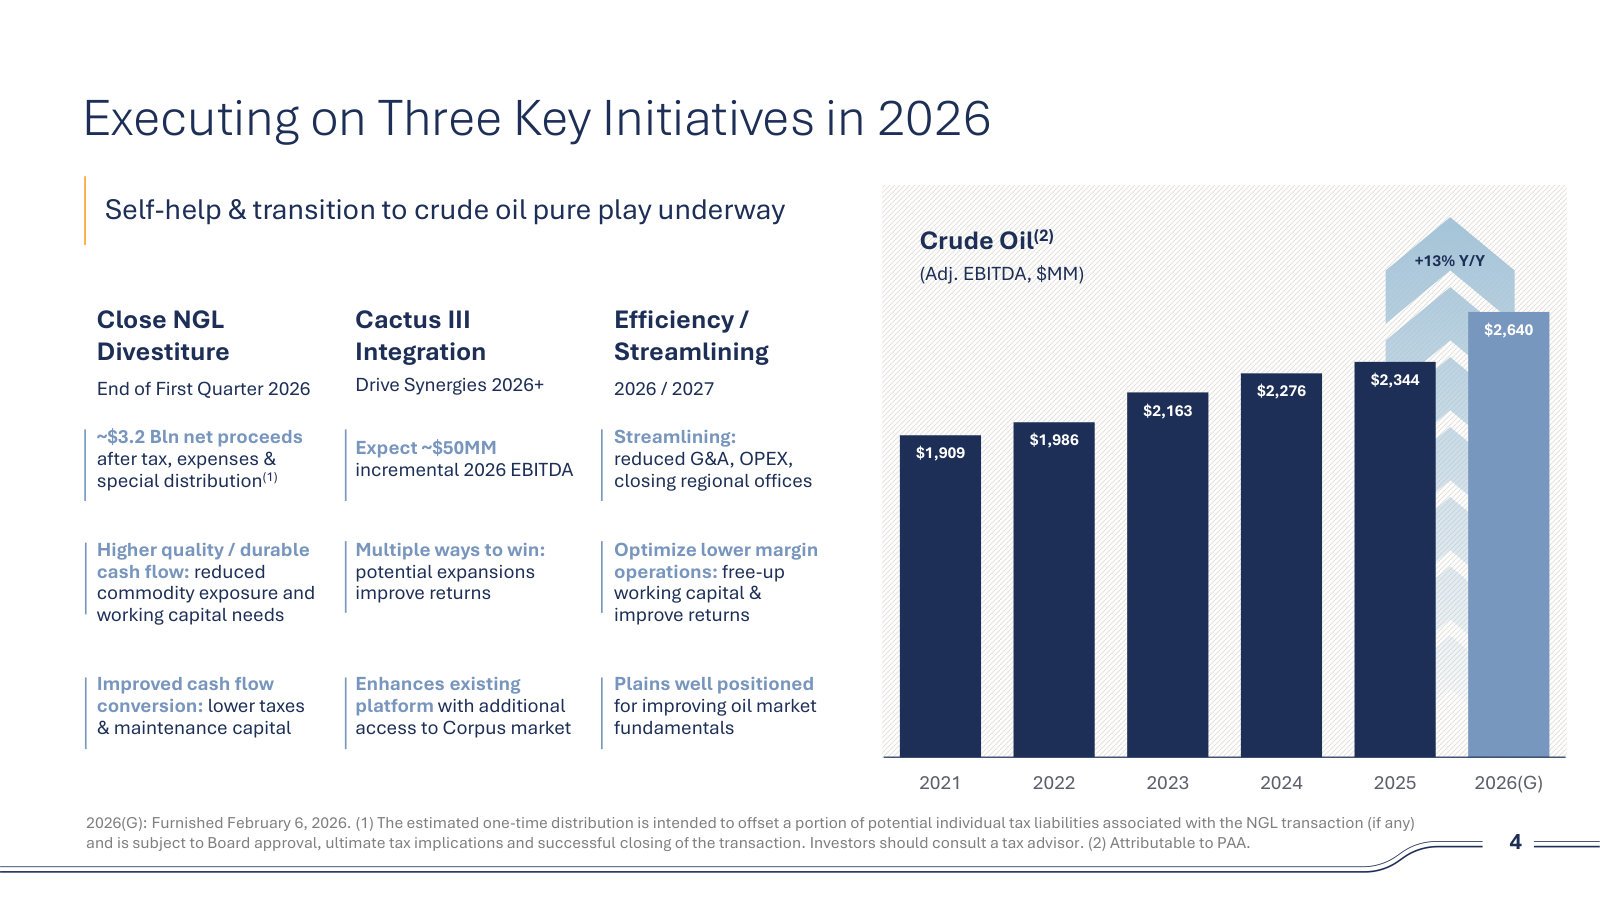
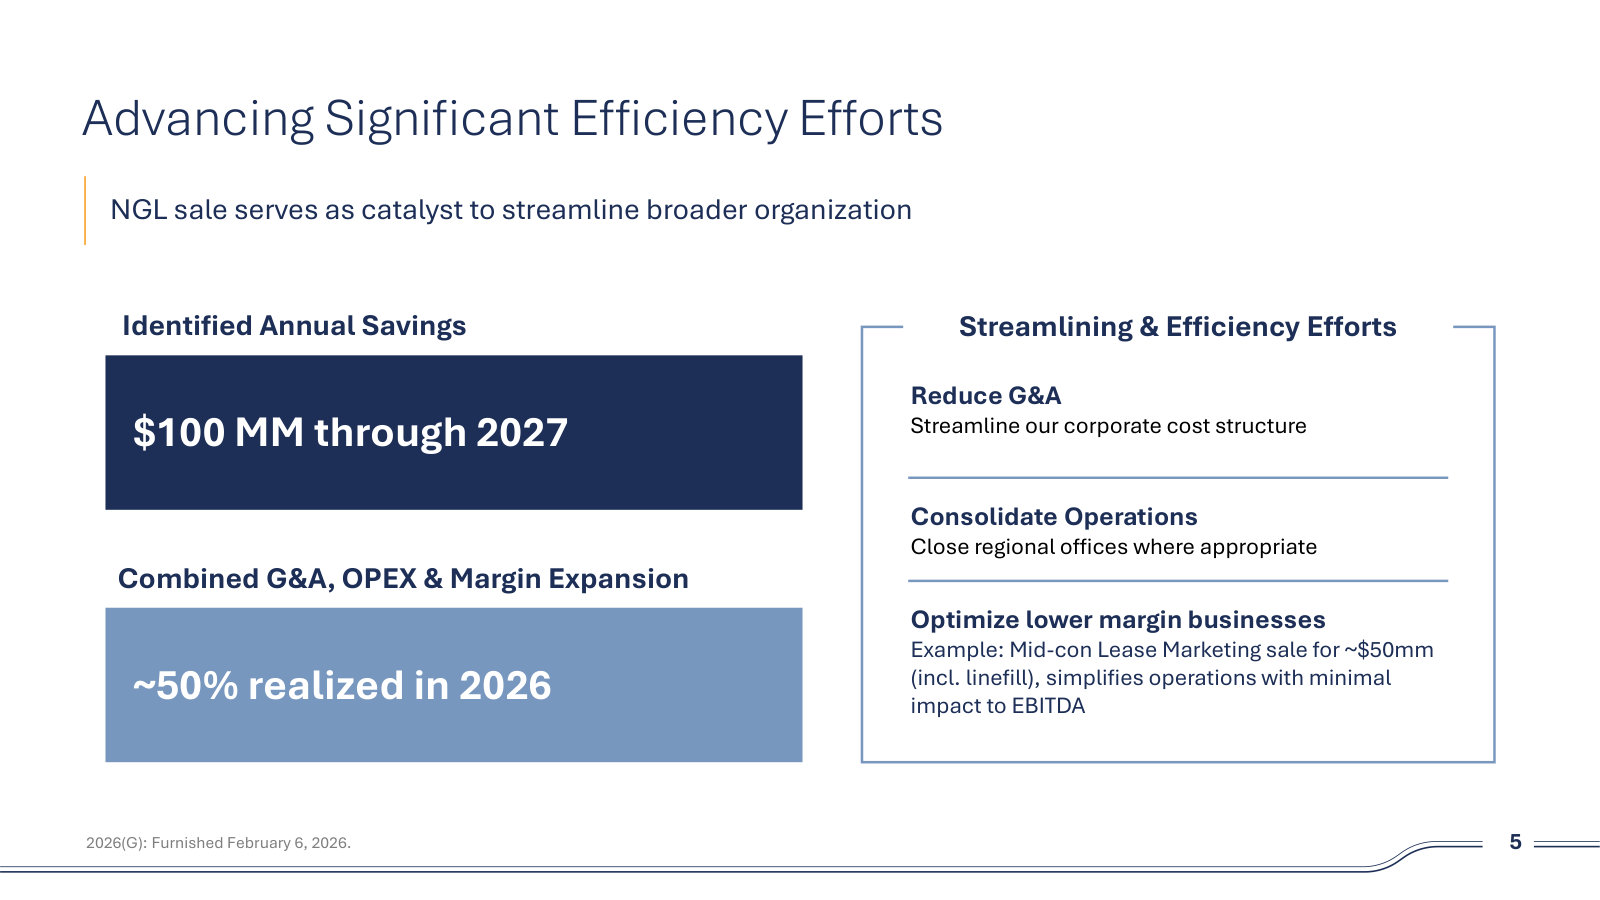
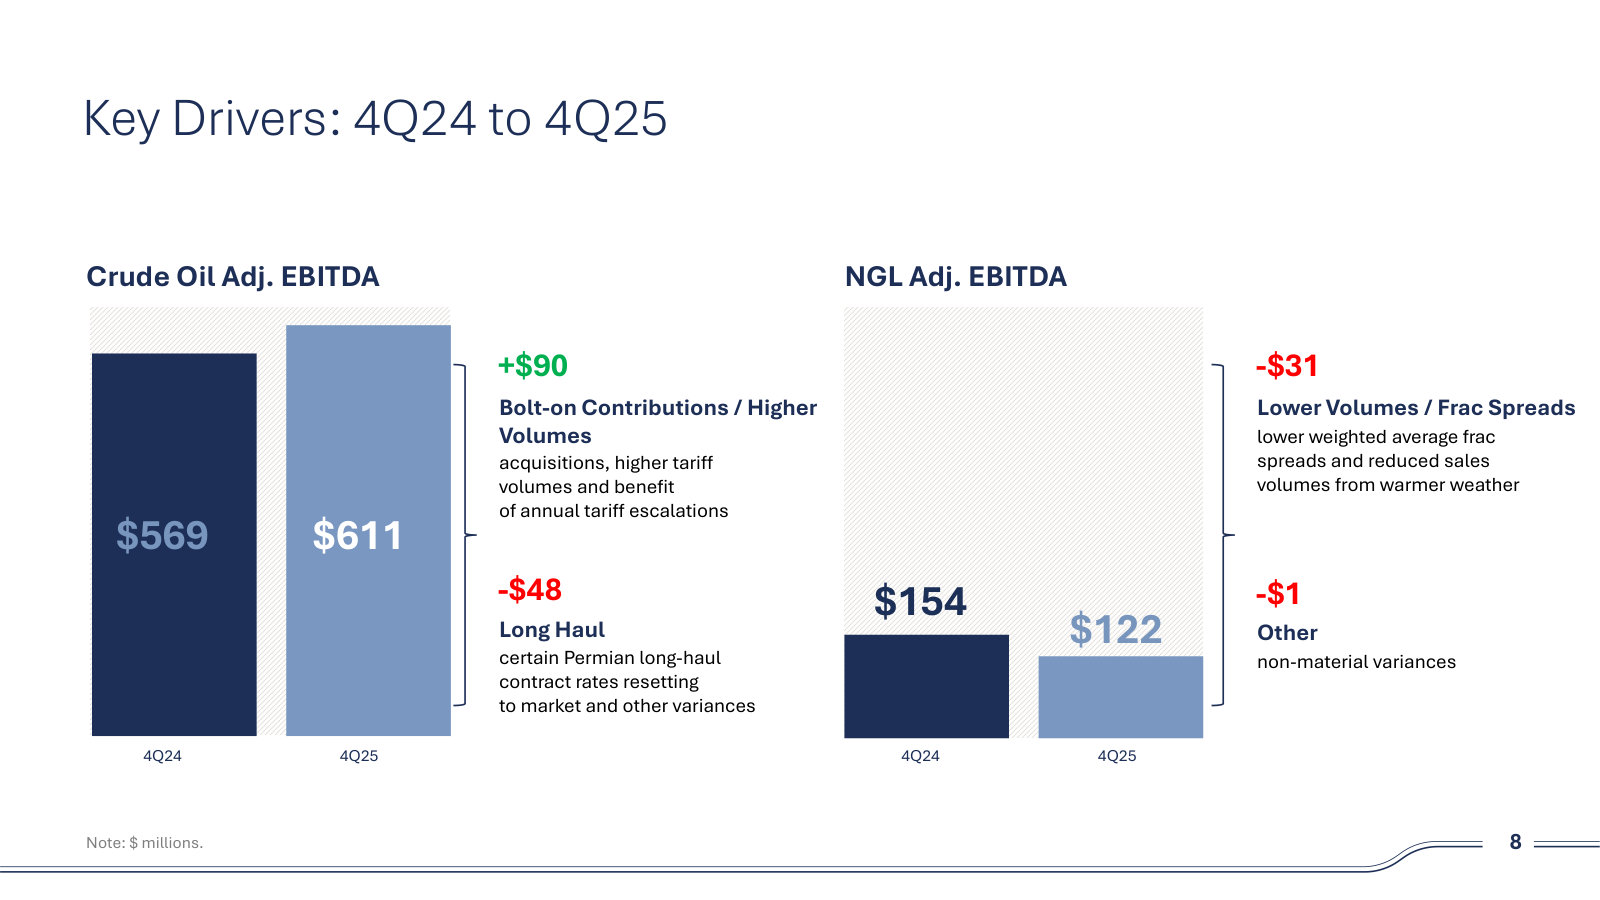
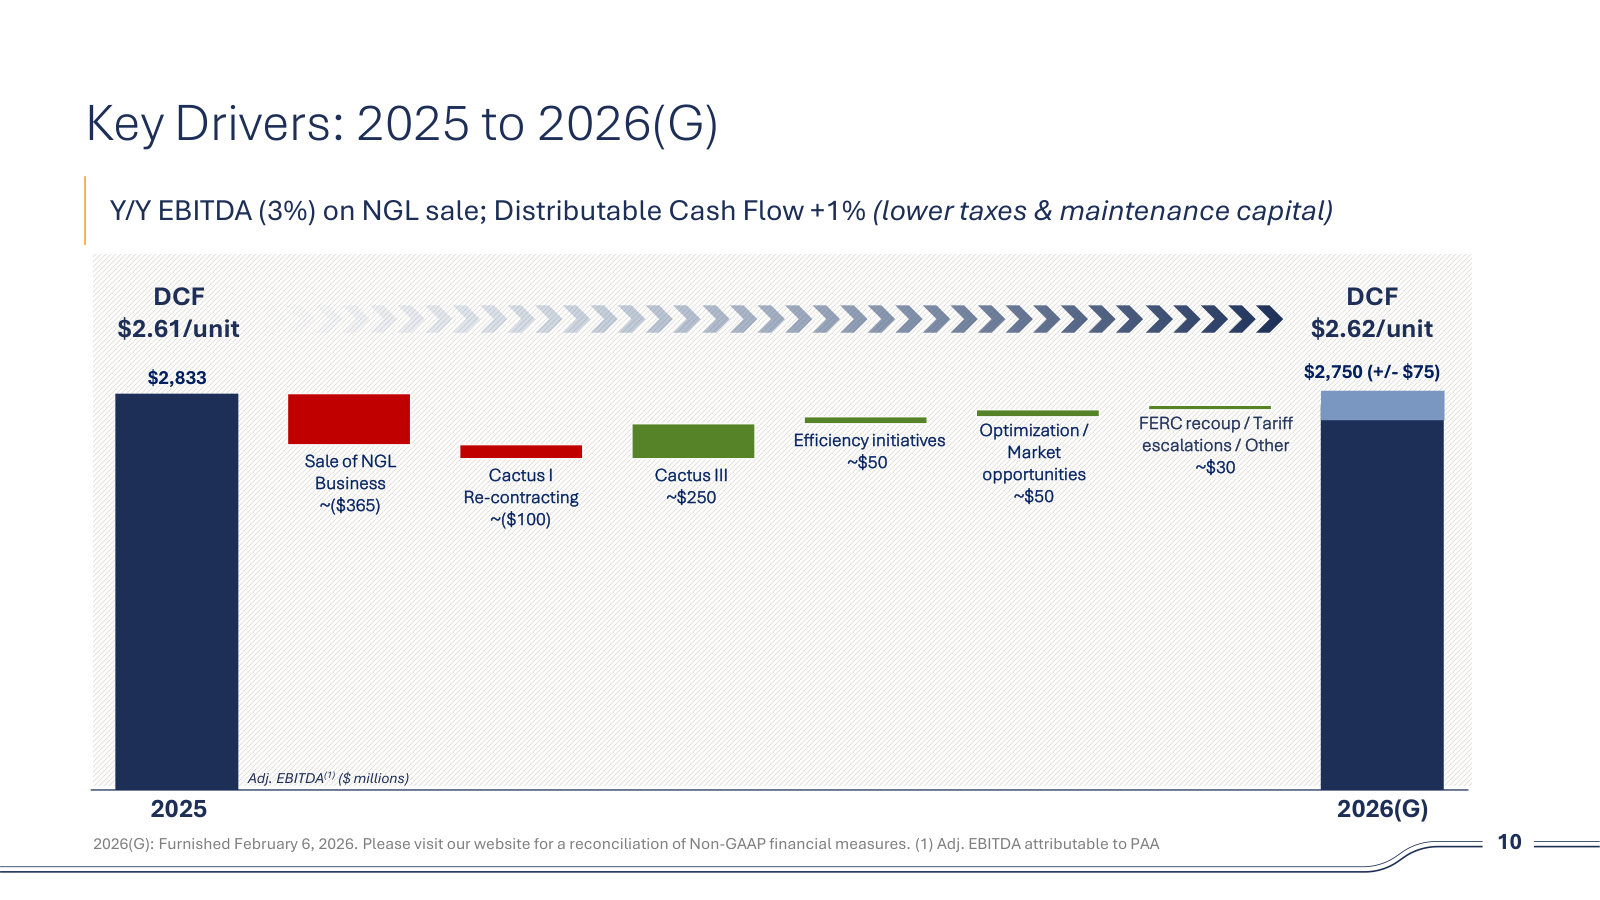
p. 3 — The 2026 setup — initial $2,750MM guidance, a 10% distribution increase, and the coverage threshold cut from 160% to 150%. · Open the full presentation →p. 4 — The three initiatives that define 2026: closing the NGL sale, integrating Cactus III, and the efficiency program. · Open the full presentation →p. 5 — The cost program in detail — $100MM of annual savings by 2027 from G&A, office consolidation and exiting low-margin lines. · Open the full presentation →p. 8 — 4Q24 to 4Q25 bridge: bolt-ons and tariff escalations add $90MM against a $48MM drag from long-haul contract resets. · Open the full presentation →p. 10 — The 2025-to-2026 waterfall — losing $365MM of NGL and $100MM of Cactus I re-contracting, replaced by Cactus III and cost savings. · Open the full presentation →
The deck that announced the NGL divestiture, and the last one that explains NGL unit economics before the segment leaves the story. · Open the full document →
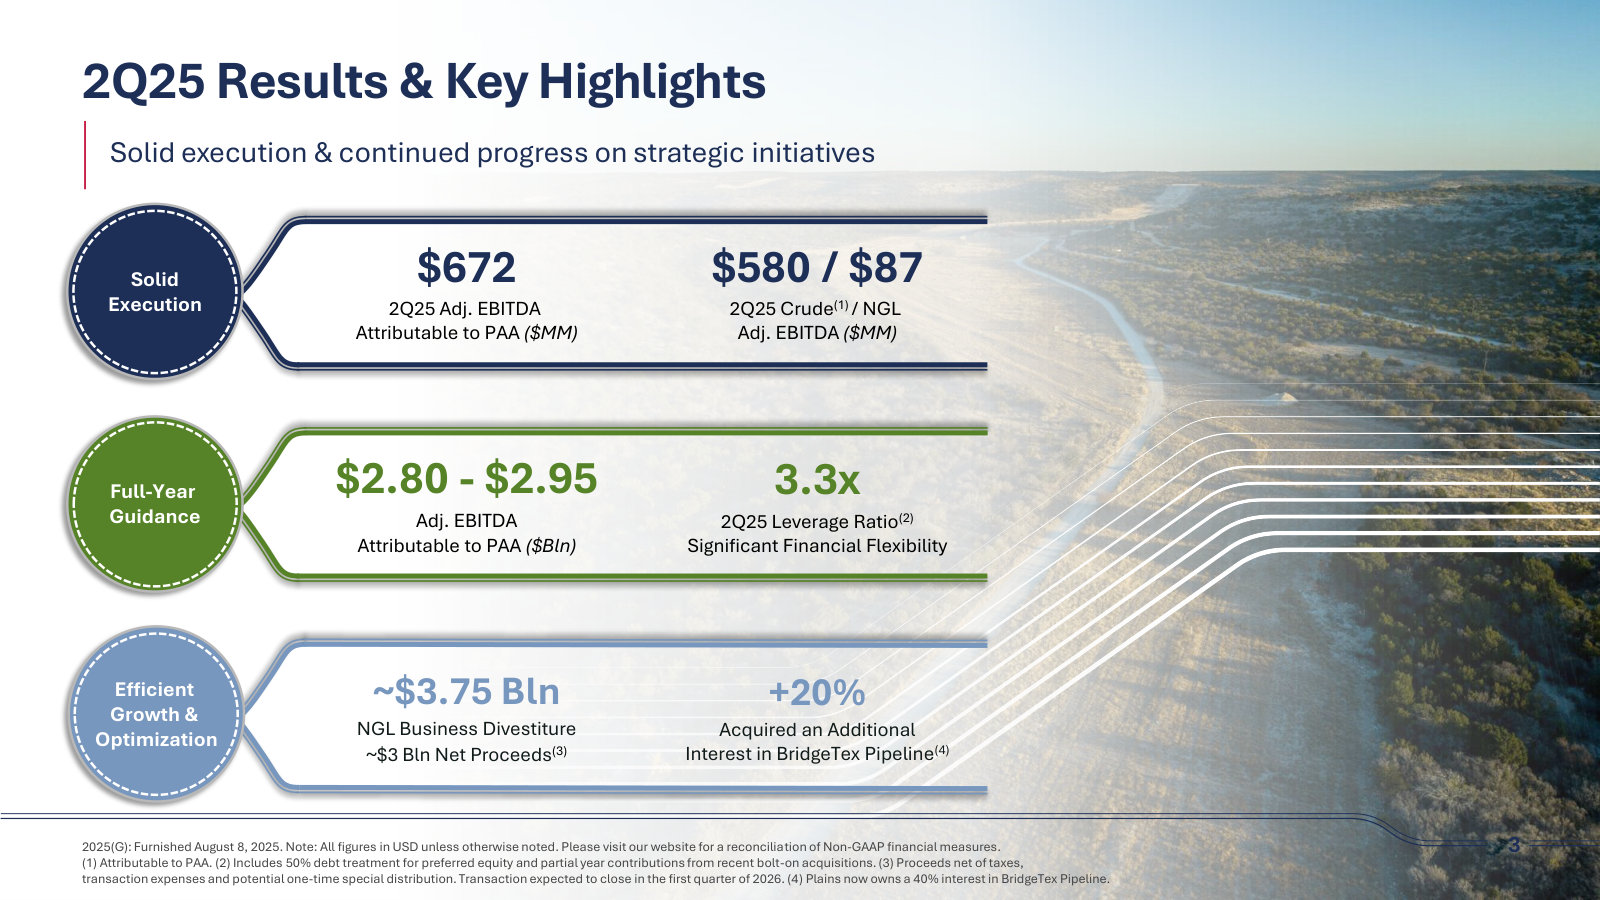
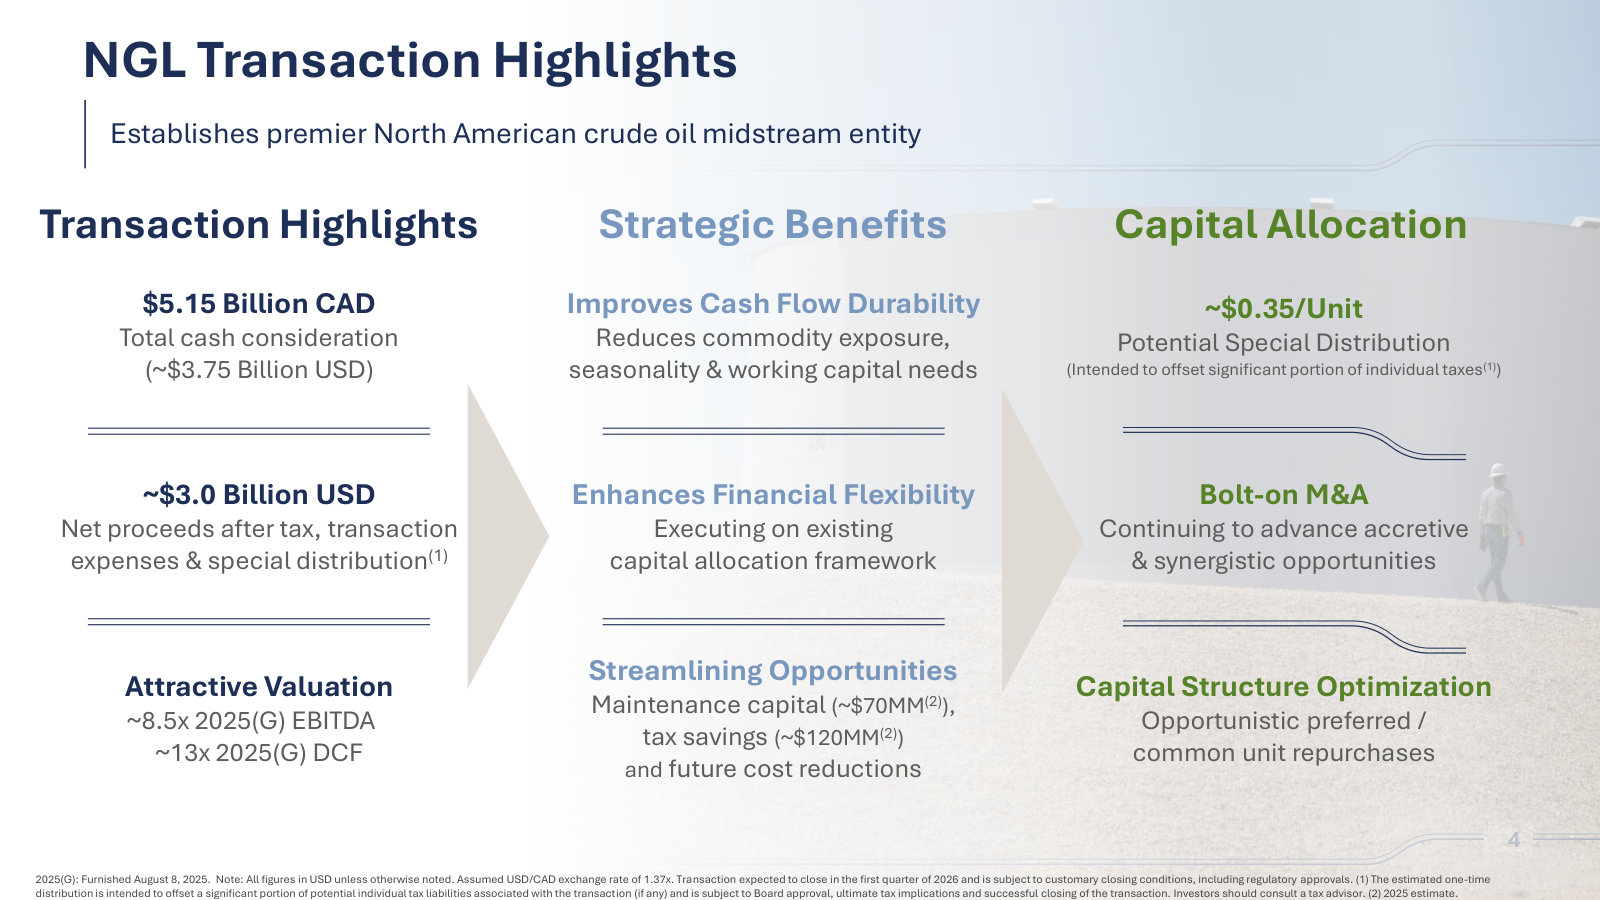
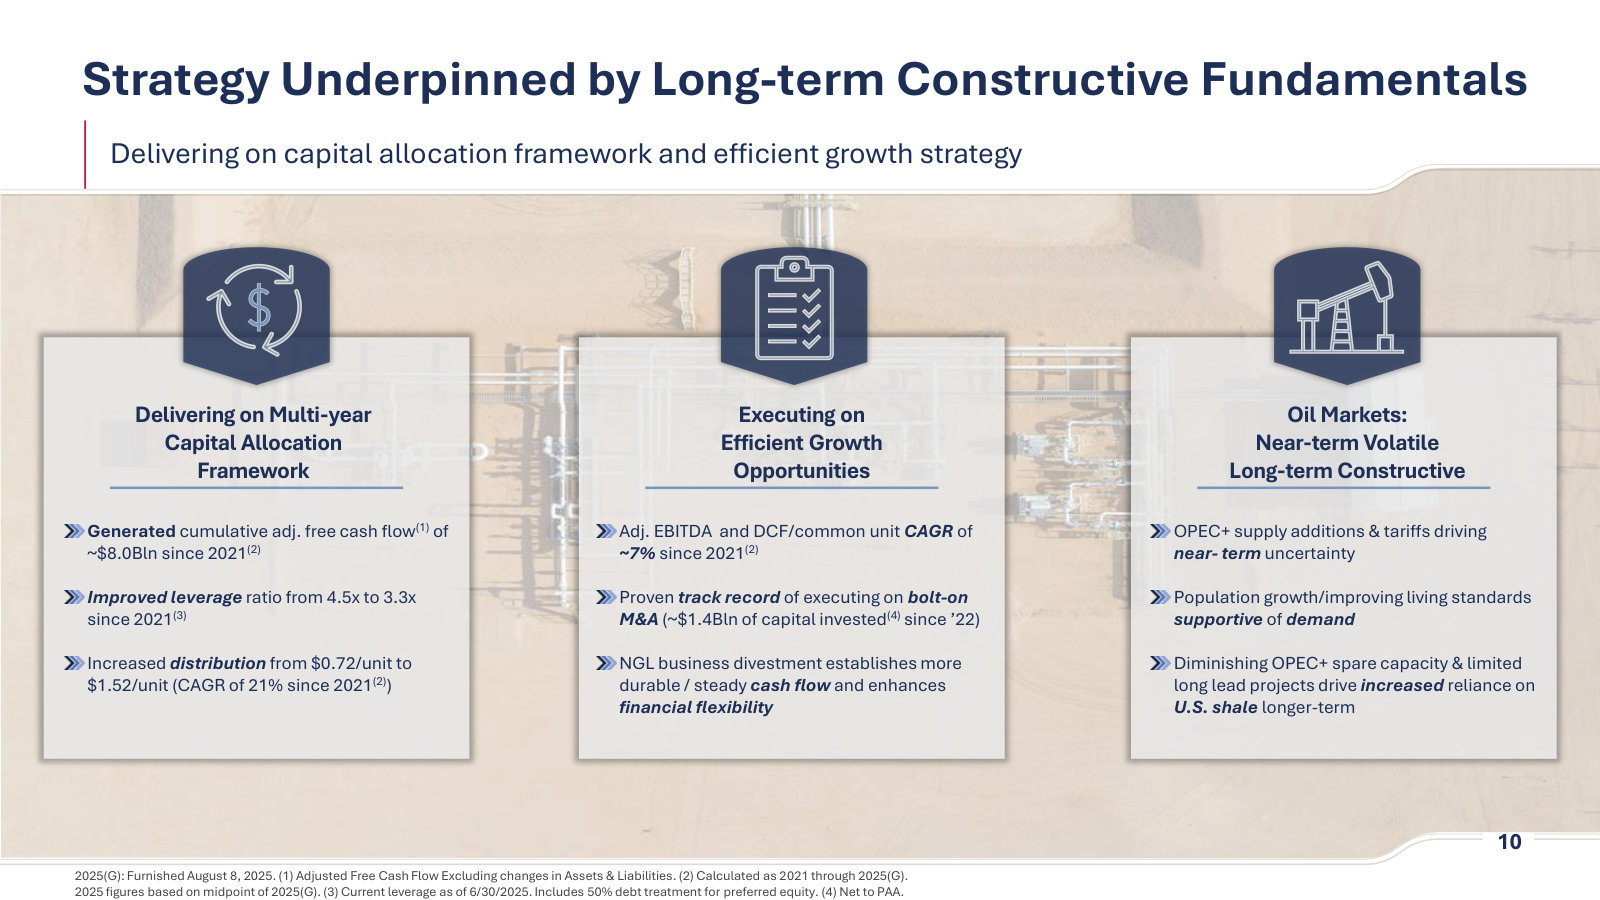
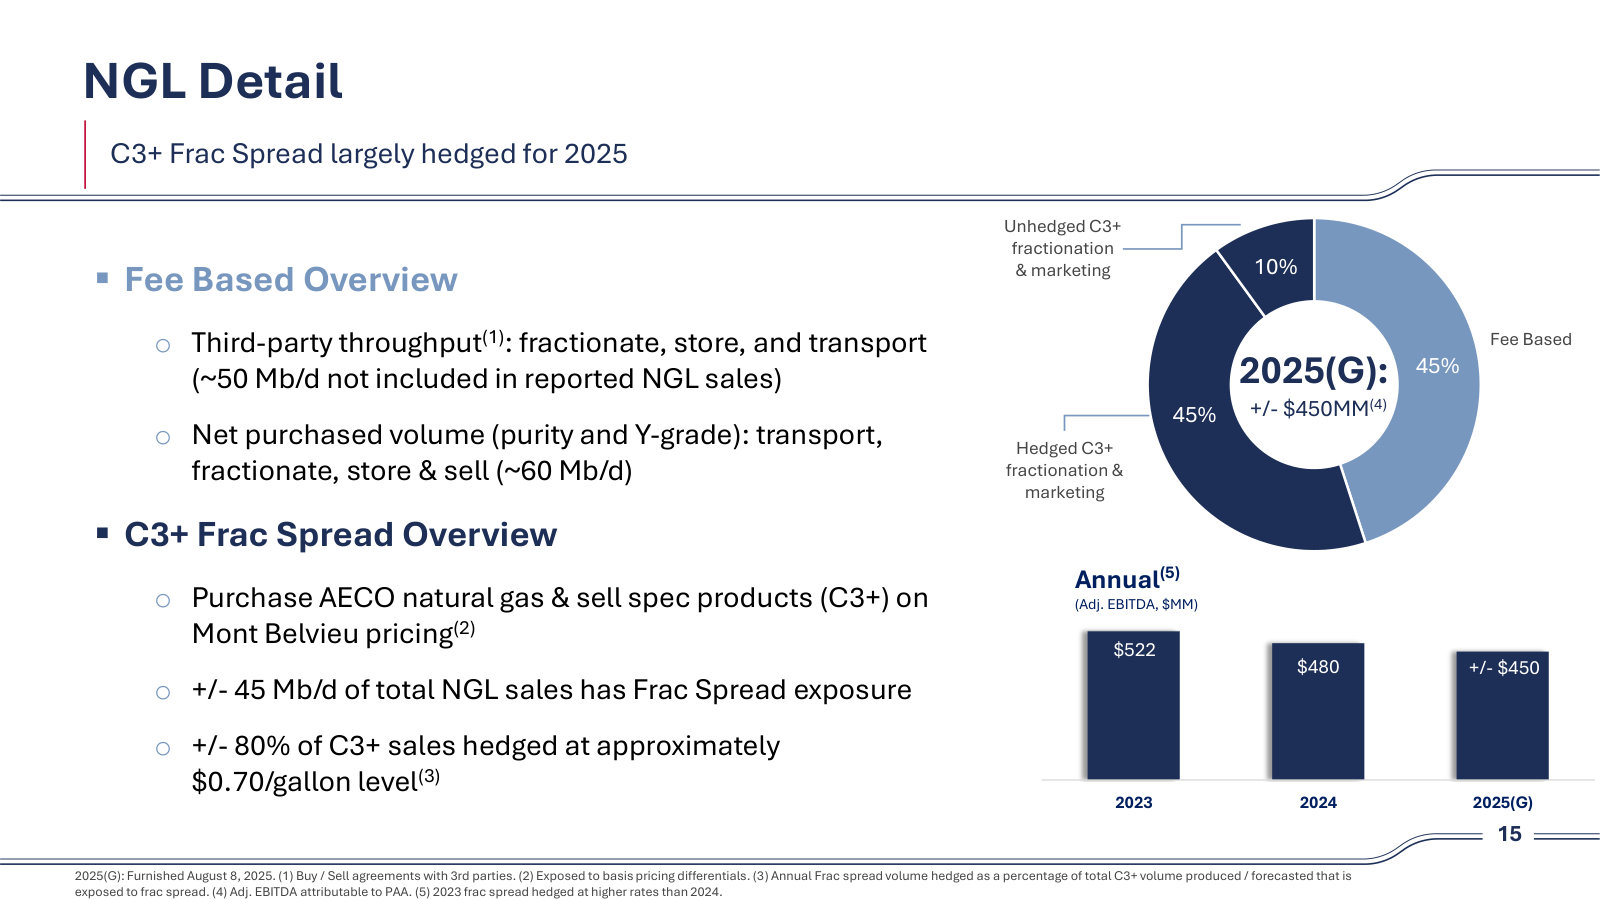
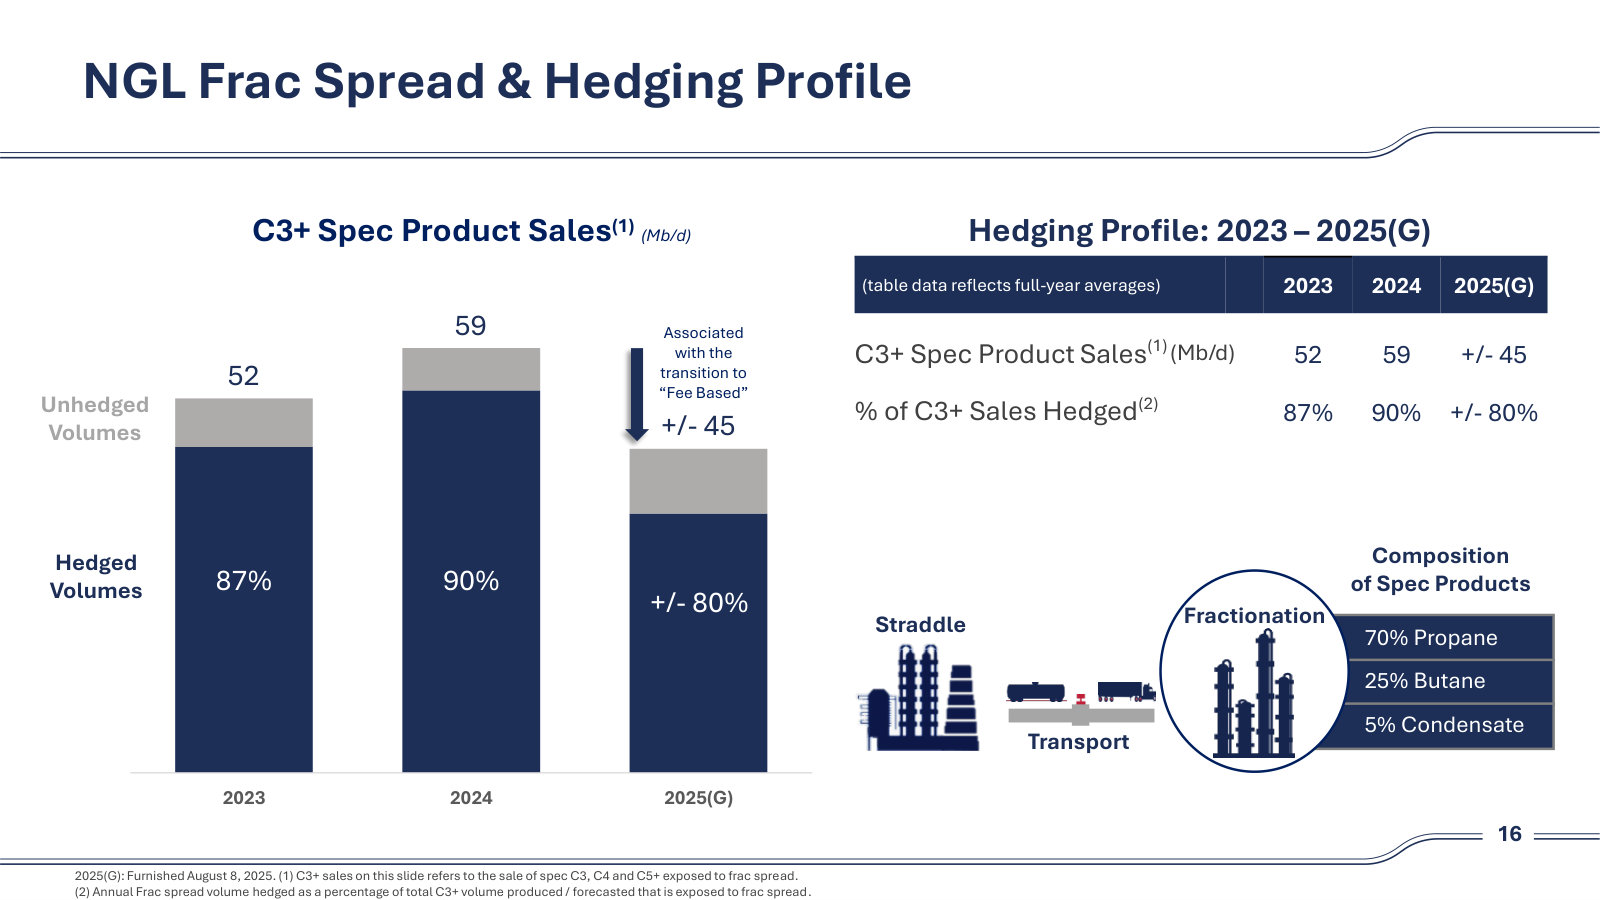
p. 3 — The quarter the strategy turned: 2Q25 results alongside the ~$3.75B NGL business sale and the BridgeTex interest purchase. · Open the full presentation →p. 4 — The NGL transaction terms and rationale — ~8.5x EBITDA, ~$3.0B net proceeds, and the case for a crude pure-play. · Open the full presentation →p. 10 — Management's track record framing: leverage 4.5x to 3.3x, distribution CAGR of 21%, and its view of oil markets. · Open the full presentation →p. 15 — How the NGL business actually earned money — 45% fee-based, 45% hedged frac spread, buying AECO gas and selling at Mont Belvieu. · Open the full presentation →p. 16 — The frac-spread hedge book and product mix; useful for reading the segment's volatility in the historical numbers. · Open the full presentation →
3Q25 Earnings Call Presentation — 3Q 2025 · 20 pages · The EPIC / Cactus III acquisition explained with the system map, plus the bar chart rebasing crude EBITDA for the pure-play transition. · Open →
1Q25 Earnings Call Presentation — 1Q 2025 · 21 pages · The quarter before the NGL sale was announced — the last clean look at the two-segment company under 2025 guidance. · Open →
4Q24 Earnings Call Presentation — 4Q 2024 · 24 pages · Permian production outlook and maps of the Ironwood and Midway bolt-ons — the clearest look at how a bolt-on gets justified. · Open →
4Q23 Earnings Call Presentation — 4Q 2023 · 24 pages · The 2024 guidance and capital allocation framework, a baseline for judging what this management has since delivered. · Open →