Full Report
The numbers behind Plains GP Holdings, L.P.: as-reported financial statements and company metrics for FY2021–FY2025, traced to the source filings, opened with the share-price history those statements have to justify. Every linked figure opens the exact page of the filing it was printed on, with the statement row highlighted. Amounts in US$ millions unless noted.
Reading notes: PAGP consolidates Plains All American Pipeline, L.P. (PAA); the great majority of consolidated net income is attributable to noncontrolling interests, so 'Net income attributable to PAGP' - not 'Net income' - is the figure that maps to PAGP's Class A shares. In June 2025 PAA agreed to sell its Canadian NGL business to Keyera. The FY2025 Form 10-K reports that business as discontinued operations and restates the 2023 and 2024 income-statement and cash-flow columns accordingly. FY2023-FY2025 in the income statement, cash flow, revenue breakdown and segment tables are therefore on a continuing-operations basis, while FY2021-FY2022 are as originally reported and still include the Canadian NGL business (about 2.5 billion dollars of FY2022 NGL segment revenue). The step down in NGL revenue and NGL Segment Adjusted EBITDA between FY2022 and FY2023 is largely this presentation change, not an operating collapse. The balance sheet is taken from each fiscal year's own Form 10-K. The FY2025 column segregates the held-for-sale Canadian NGL business into 'of discontinued operations' lines (3,036 million of assets and 988 million of liabilities at December 31, 2025), so FY2025 line items such as property and equipment, net are not directly comparable with FY2021-FY2024; Total assets, Total current assets and the capital lines are unaffected. FY2019 and FY2020 long-term-record figures are comparative columns of the FY2021 and FY2022 Forms 10-K. FY2016-FY2018 figures come from the standardized SEC XBRL data feed and carry no page links; diluted earnings per Class A share is not available in the feed for those years.
Share Price — Full Available History — 13 Years
The stock closed at $26.33 on Jul 31, 2026 — down 55% over the window shown (-6.1% a year), trading between $3.49 and $85.19. At that close the stock trades at 20× FY2025 diluted EPS as reported below.
Source: market price feed, monthly closes, sampled from 3,217 source observations, Oct 2013–Jul 2026. Price return only, excludes dividends.
FY2025 at a Glance
Revenue (US$ millions)
Operating income (US$ millions)
Net income (US$ millions)
Diluted EPS
Source: FY2025 consolidated statements [1] [2]. Click any linked figure to open the filing page with the row highlighted.
Revenues by Segment and Activity
| Revenues by Segment and Activity | FY2021 | FY2022 | FY2023 | FY2024 | FY2025 |
|---|---|---|---|---|---|
| Crude Oil - Sales | 39,635 | 53,822 | 45,621 | 47,036 | 42,408 |
| Crude Oil - Transportation | 484 | 745 | 1,144 | 1,231 | 1,330 |
| Crude Oil - Terminalling, Storage and Other | 431 | 362 | 381 | 384 | 349 |
| Total Crude Oil segment revenues from contracts with customers | 40,550 | 54,929 | 47,146 | 48,651 | 44,087 |
| NGL - Sales | 2,292 | 2,414 | 179 | 180 | 144 |
| NGL - Transportation | 25 | 30 | — | — | — |
| NGL - Terminalling, Storage and Other | 82 | 100 | 7 | 7 | 6 |
| Total NGL segment revenues from contracts with customers | 2,399 | 2,544 | 186 | 187 | 150 |
| Total revenues | 42,078 | 57,342 | 47,336 | 48,889 | 44,262 |
| Total revenues growth, derived | — | +36.3% | -17.4% | +3.3% | -9.5% |
Source: Form 10-K revenue note - revenues from contracts with customers disaggregated by segment and type of activity, with the reconciliation to total revenues [3] [4] [5] [6]. Click any linked figure to open the filing page with the row highlighted.
Segment Adjusted EBITDA and Capital Expenditures
| Segment Adjusted EBITDA and Capital Expenditures | FY2021 | FY2022 | FY2023 | FY2024 | FY2025 |
|---|---|---|---|---|---|
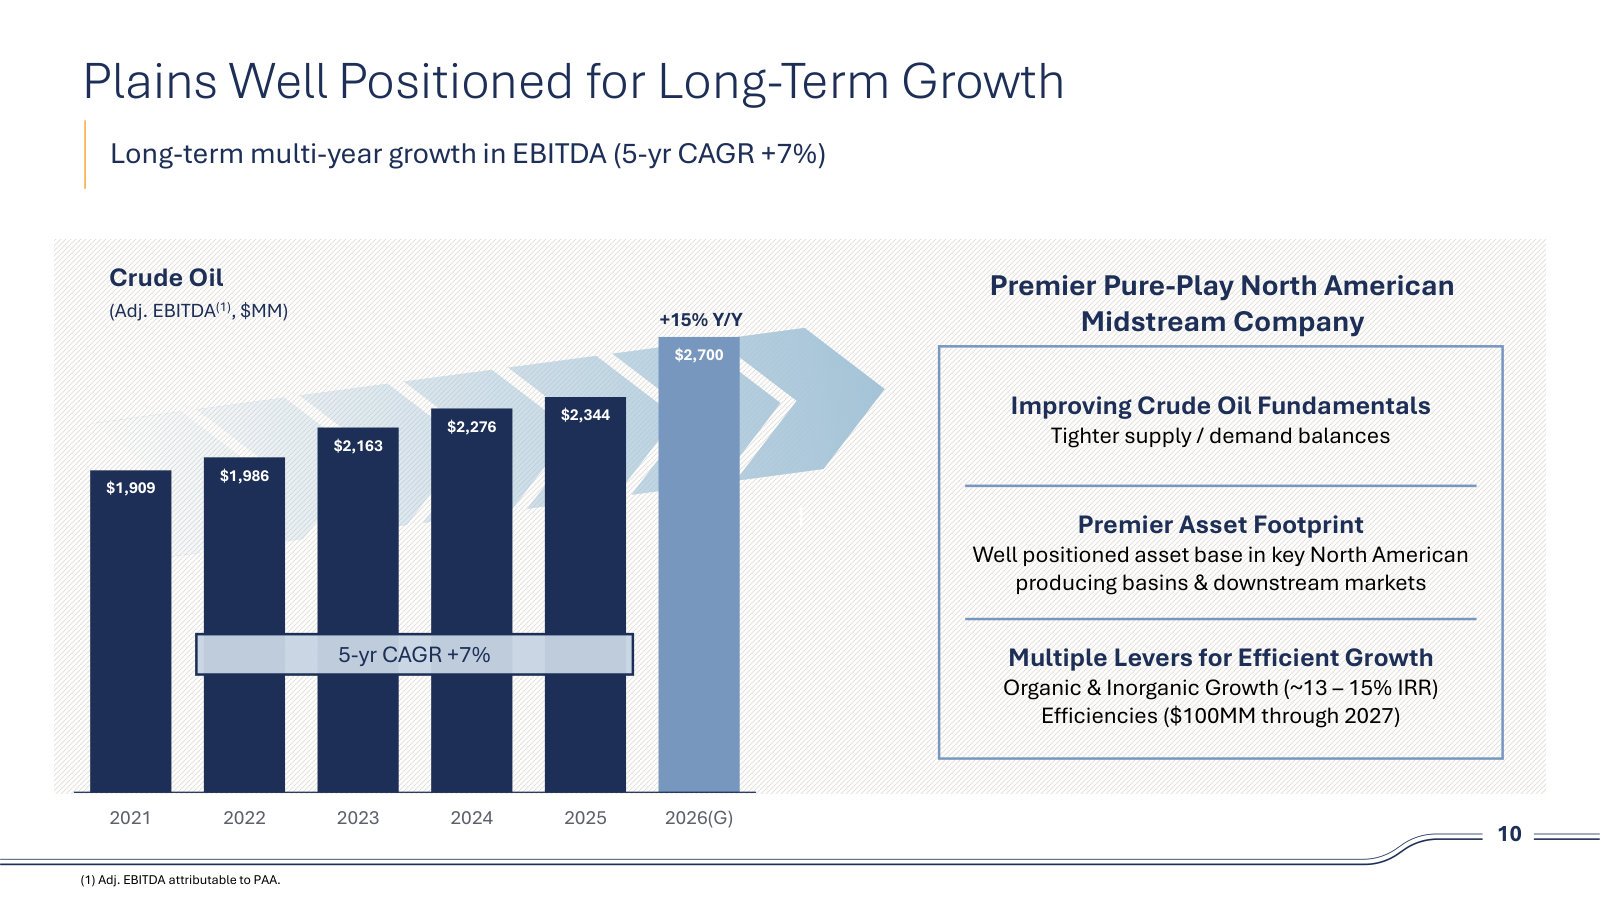
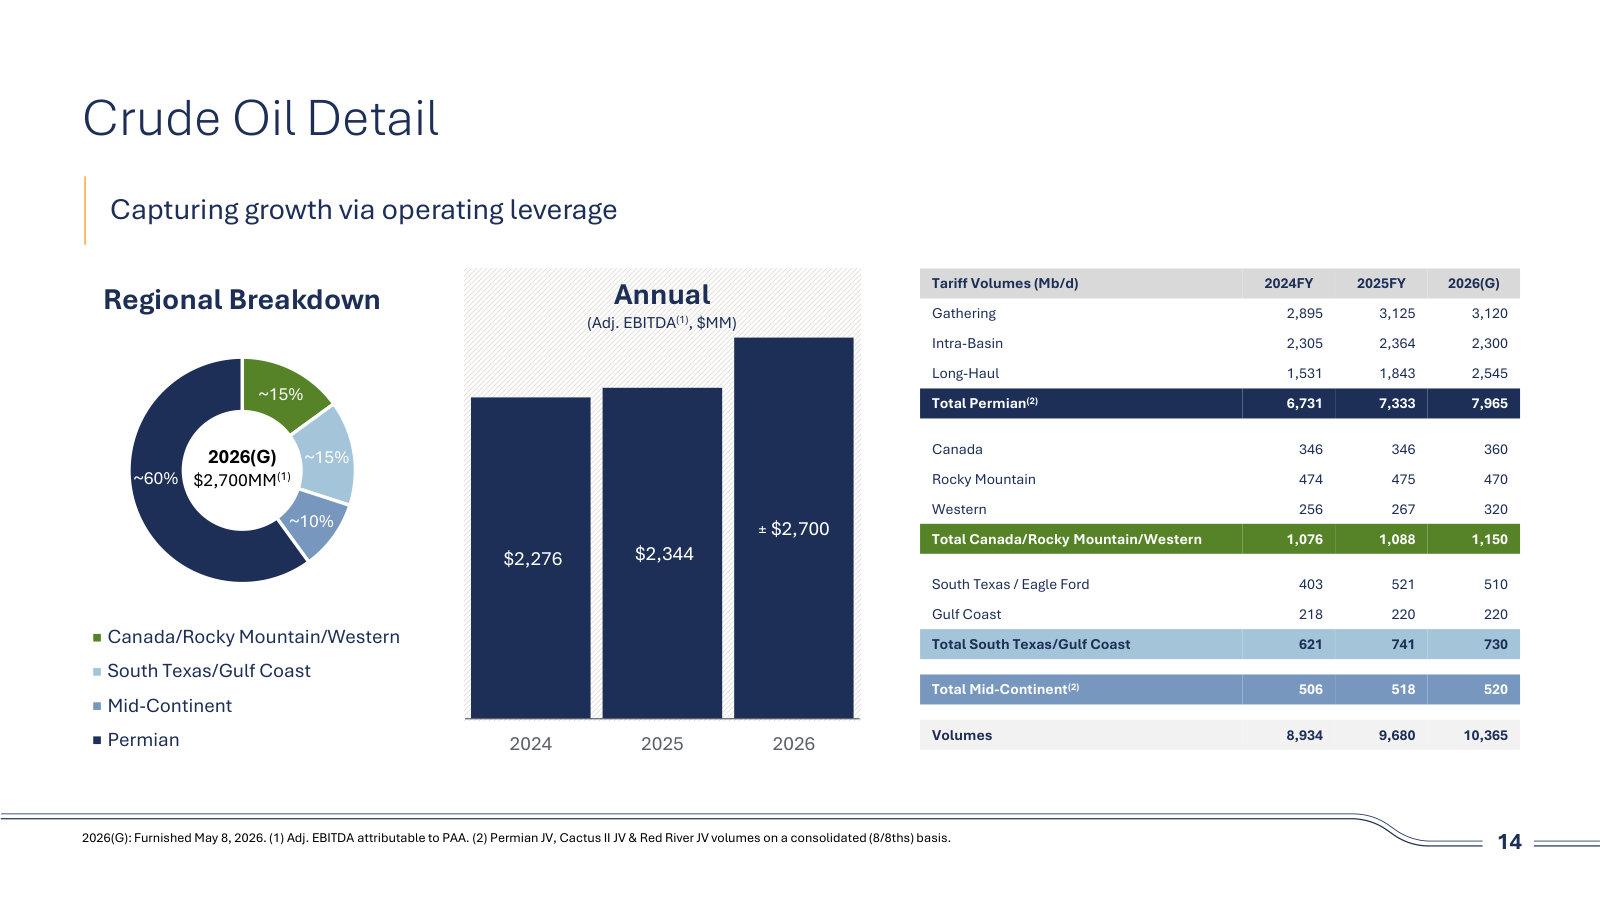
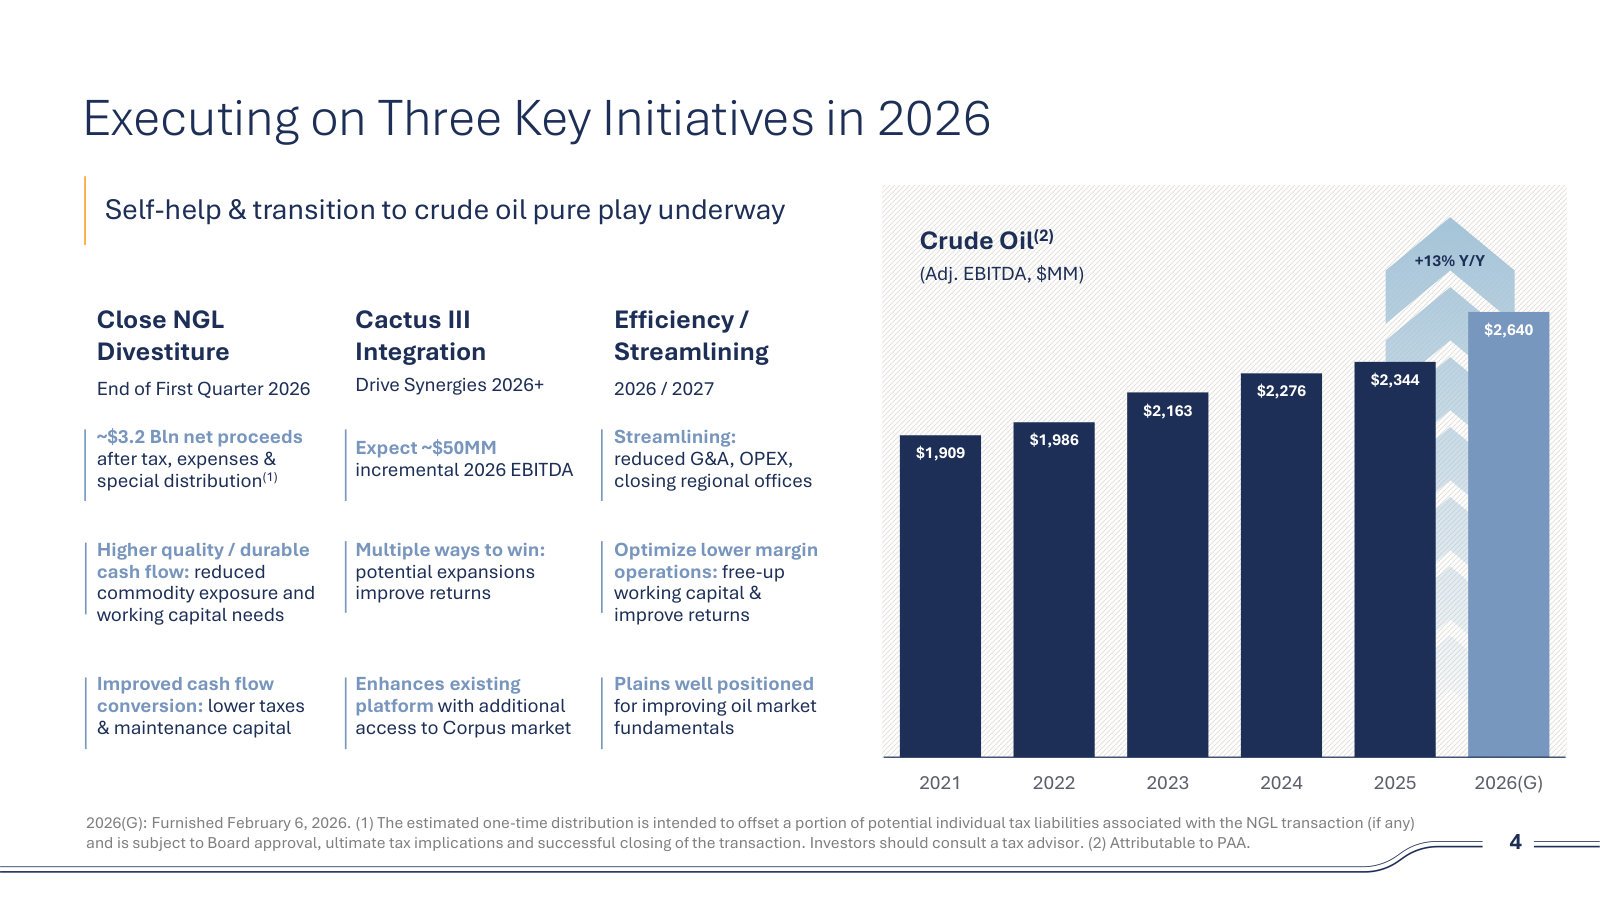
| Crude Oil | 1,909 | 1,986 | 2,163 | 2,276 | 2,344 |
| NGL | 285 | 518 | (30) | (21) | (34) |
| Segment Adjusted EBITDA | 2,194 | 2,504 | 2,133 | 2,255 | 2,310 |
| Investment and acquisition capital expenditures | 269 | 618 | 765 | 554 | 3,321 |
| Maintenance capital expenditures | 168 | 211 | 151 | 187 | 156 |
Source: Form 10-K segment footnote (Note 20) and the Segment Adjusted EBITDA reconciliation. FY2023-FY2025 are continuing operations only [7] [8] [9] [10]. Click any linked figure to open the filing page with the row highlighted.
Income Statement
Source: Consolidated Statements of Operations. FY2023-FY2025 are the continuing-operations columns of the FY2025 Form 10-K (Canadian NGL business reported as discontinued operations); FY2021-FY2022 are as originally reported in the FY2022 Form 10-K [1] [2]. Click any linked figure to open the filing page with the row highlighted.
Columns marked E are consensus analyst estimates from S&P Capital IQ (CapIQ), shown alongside reported results for direct comparison; they are not company guidance.
Estimate source: S&P Capital IQ (CapIQ) consensus, as of 2026-08-03. Estimate figures are S&P Capital IQ consensus (vendor data — no filing page links). EPS and net income use the normalized (adjusted) consensus where the street reports it. Line-item analyst models (segments, drivers, KPIs) are in the Visible Alpha tab.
Balance Sheet
Source: Consolidated Balance Sheets, each fiscal year taken from its own Form 10-K [11] [12] [13] [14]. Click any linked figure to open the filing page with the row highlighted.
Cash Flow
Source: Consolidated Statements of Cash Flows. FY2023-FY2025 from the FY2025 Form 10-K; FY2021-FY2022 from the FY2022 Form 10-K [15] [16]. Click any linked figure to open the filing page with the row highlighted.
Crude Oil Pipeline Throughput
| Crude Oil Pipeline Throughput | FY2021 | FY2022 | FY2023 | FY2024 | FY2025 |
|---|---|---|---|---|---|
| Permian Basin pipeline tariff volumes (MBbl/d) | 4,412 | 5,638 | 6,356 | 6,731 | 7,333 |
| Total crude oil pipeline tariff volumes (MBbl/d) | 6,205 | 7,565 | 8,460 | 8,934 | 9,680 |
| Crude oil lease gathering purchases (MBbl/d) | 1,330 | 1,382 | 1,452 | 1,586 | — |
Source: company filings [17] [18] [19] [20]. Click any linked figure to open the filing page with the row highlighted.
Adjusted EBITDA (Non-GAAP, as reported)
| Adjusted EBITDA (Non-GAAP, as reported) | FY2021 | FY2022 | FY2023 | FY2024 | FY2025 |
|---|---|---|---|---|---|
| Adjusted EBITDA (consolidated) | 2,290 | 2,875 | 3,167 | 3,326 | 3,374 |
| Adjusted EBITDA attributable to noncontrolling interests in consolidated JVs | (94) | (365) | (456) | (547) | (541) |
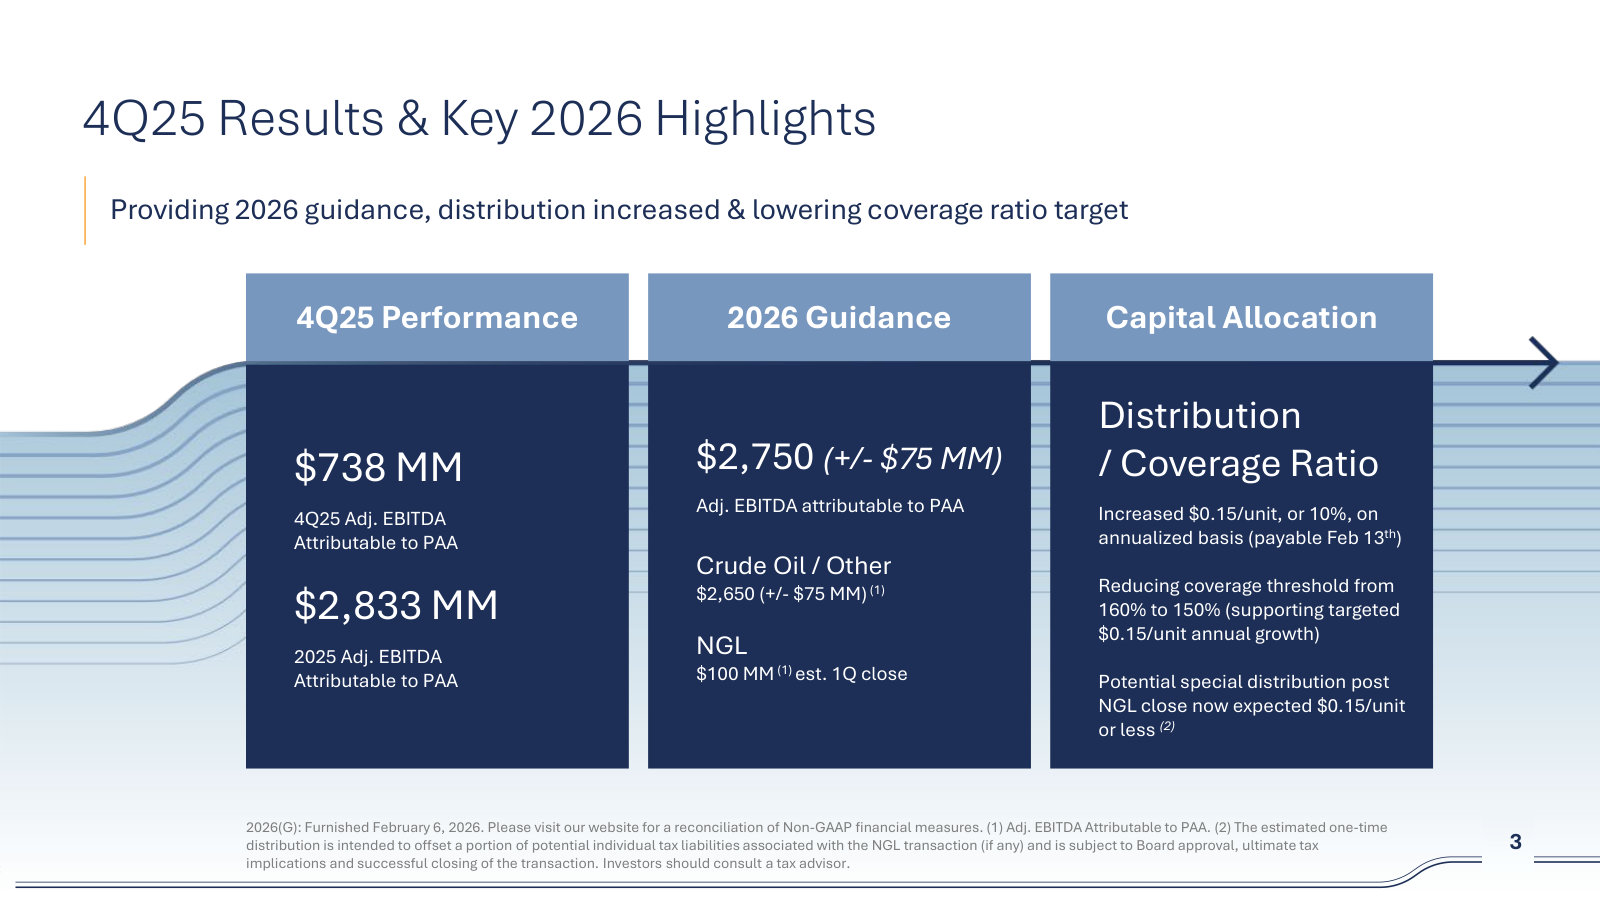
| Adjusted EBITDA attributable to PAA | 2,196 | 2,510 | 2,711 | 2,779 | 2,833 |
Source: company filings [21] [22] [23] [24]. Click any linked figure to open the filing page with the row highlighted.
Distributions, Contract Backlog and Customer Mix
| Distributions, Contract Backlog and Customer Mix | FY2021 | FY2022 | FY2023 | FY2024 | FY2025 |
|---|---|---|---|---|---|
| Distribution paid per common unit / Class A share ($) | 0.72 | 0.83 | 1.07 | 1.27 | 1.52 |
| Contracted MVC / capacity revenue, following year | 416 | 583 | 609 | 630 | 639 |
| ExxonMobil % of consolidated revenues | 15.0% | 20.0% | 27.0% | 31.0% | 31.0% |
Source: company filings [25] [26] [27] [28]. Click any linked figure to open the filing page with the row highlighted.
Long-Term Record
| Fiscal year | Total revenues | Operating income | Net income attributable to PAGP | Diluted net income per Class A share | Net cash provided by operating activities | Additions to property, equipment and other |
|---|---|---|---|---|---|---|
| FY2016 | 20,182 | 990 | 94 | — | 718 | (1,334) |
| FY2017 | 26,223 | 1,147 | (731) | — | 2,496 | (1,024) |
| FY2018 | 34,055 | 2,272 | 334 | — | 2,604 | (1,634) |
| FY2019 | 33,669 | 1,980 | 331 | 1.96 | 2,500 | (1,181) |
| FY2020 | 23,290 | (2,383) | (568) | (3.07) | 1,510 | (738) |
| FY2021 | 42,078 | 842 | 60 | 0.31 | 1,991 | (336) |
| FY2022 | 57,342 | 1,284 | 168 | 0.86 | 2,404 | (455) |
| FY2023 | 47,336 | 1,249 | 198 | 1.00 | 2,722 | (408) |
| FY2024 | 48,889 | 862 | 103 | 0.51 | 2,484 | (448) |
| FY2025 | 44,262 | 1,428 | 260 | 1.30 | 2,931 | (643) |
Source: consolidated statements across filings; older years from the standardized feed [15] [1] [16] [2]. Click any linked figure to open the filing page with the row highlighted.
Operating KPIs
| KPI | FY2021 | FY2022 | FY2023 | FY2024 | FY2025 |
|---|---|---|---|---|---|
| Permian Basin crude oil pipeline tariff volumes | 4,412,000 | 5,638,000 | 6,356,000 | 6,731,000 | 7,333,000 |
| Total crude oil pipeline tariff volumes | 6,205,000 | 7,565,000 | 8,460,000 | 8,934,000 | 9,680,000 |
Source: company-reported operating metrics [17] [18] [19] [20]. Click any linked figure to open the filing page with the row highlighted.
Analyst Consensus
Mean target
Median target
High target
Low target
Street ratings: 6 strong buy, 1 buy, 6 hold, 2 sell. Consensus: Buy.
Estimate source: S&P Capital IQ (CapIQ) consensus, as of 2026-08-03. Estimate figures are S&P Capital IQ consensus (vendor data — no filing page links). EPS and net income use the normalized (adjusted) consensus where the street reports it. Line-item analyst models (segments, drivers, KPIs) are in the Visible Alpha tab.
Traceability
568 of 583 figures on this page (97%) link to the filing page where they are printed — click a linked figure to open the source PDF at that page with the row highlighted. Unlinked figures come from standardized data feeds or pre-filing years.
PAGP consolidates Plains All American Pipeline, L.P. (PAA); the great majority of consolidated net income is attributable to noncontrolling interests, so 'Net income attributable to PAGP' - not 'Net income' - is the figure that maps to PAGP's Class A shares.
In June 2025 PAA agreed to sell its Canadian NGL business to Keyera. The FY2025 Form 10-K reports that business as discontinued operations and restates the 2023 and 2024 income-statement and cash-flow columns accordingly. FY2023-FY2025 in the income statement, cash flow, revenue breakdown and segment tables are therefore on a continuing-operations basis, while FY2021-FY2022 are as originally reported and still include the Canadian NGL business (about 2.5 billion dollars of FY2022 NGL segment revenue). The step down in NGL revenue and NGL Segment Adjusted EBITDA between FY2022 and FY2023 is largely this presentation change, not an operating collapse.
The balance sheet is taken from each fiscal year's own Form 10-K. The FY2025 column segregates the held-for-sale Canadian NGL business into 'of discontinued operations' lines (3,036 million of assets and 988 million of liabilities at December 31, 2025), so FY2025 line items such as property and equipment, net are not directly comparable with FY2021-FY2024; Total assets, Total current assets and the capital lines are unaffected.
FY2019 and FY2020 long-term-record figures are comparative columns of the FY2021 and FY2022 Forms 10-K. FY2016-FY2018 figures come from the standardized SEC XBRL data feed and carry no page links; diluted earnings per Class A share is not available in the feed for those years.
The FY2022 Form 10-K prints a Transportation line inside the NGL segment revenue disaggregation; the FY2025 Form 10-K's continuing-operations NGL table has no Transportation line, so those cells are blank for FY2023-FY2025.
Segment Adjusted EBITDA is the partnership's own segment profit measure as defined in Note 20; the FY2023-FY2025 totals (2,133 / 2,255 / 2,310) exclude the discontinued Canadian NGL business, while the FY2021-FY2022 totals (2,194 / 2,504) include it.
Crude oil pipeline tariff volumes are average daily volumes in barrels per day, from the Crude Oil segment tables in each Form 10-K's Analysis of Operating Segments.
5 figure(s) differed between the data feed and the filing; the filing value is shown (see the run's metrics/metrics_tab.json for the audit trail).
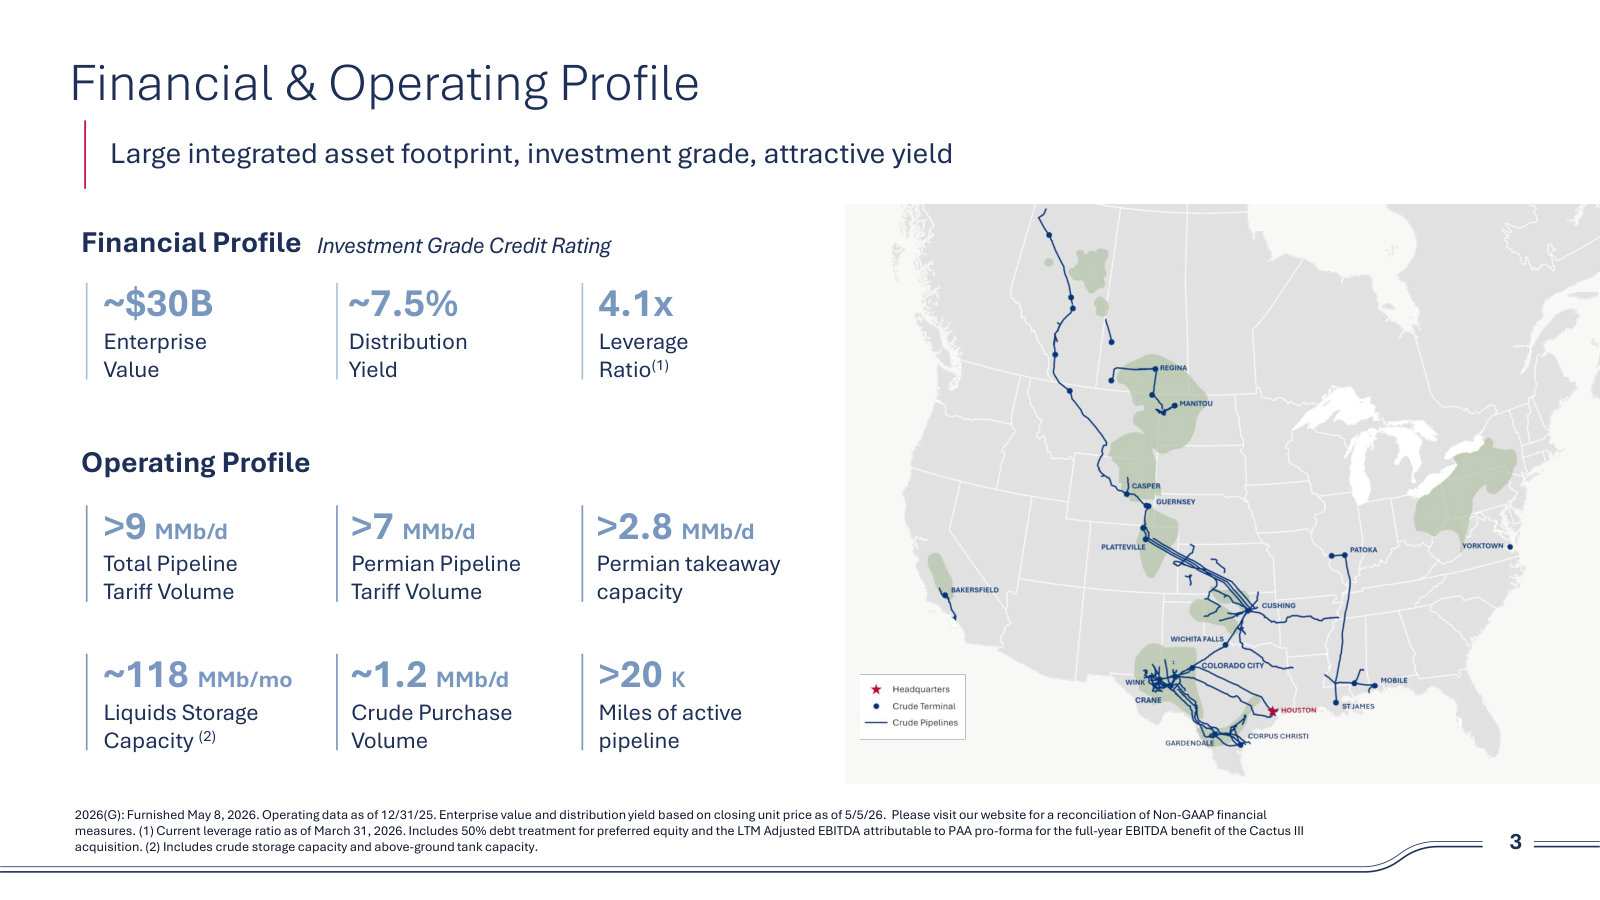
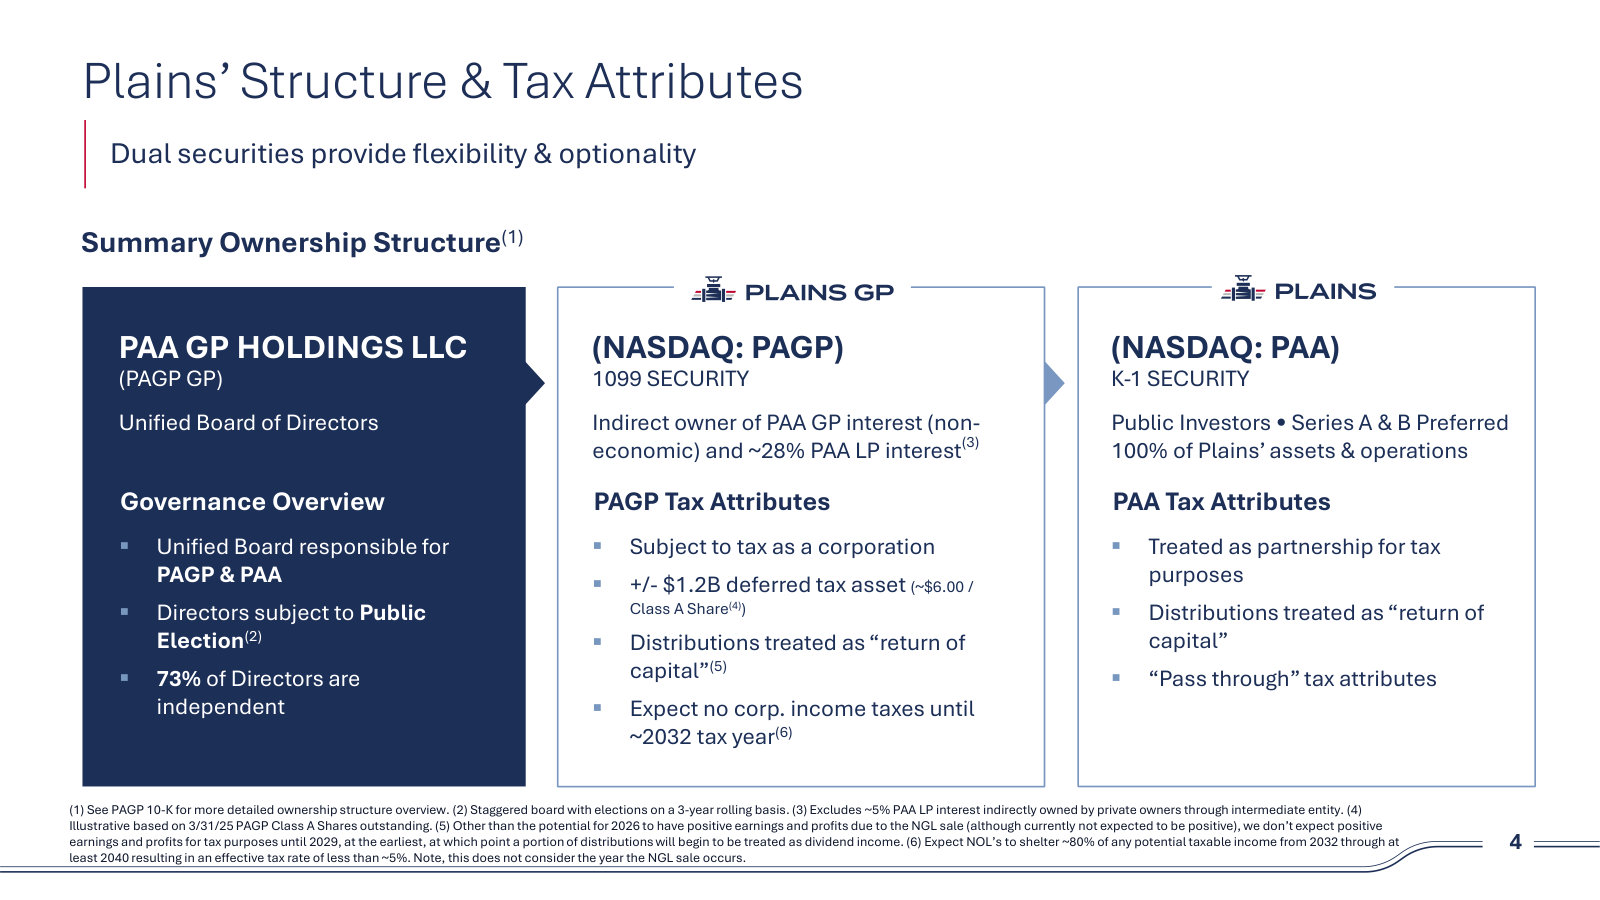
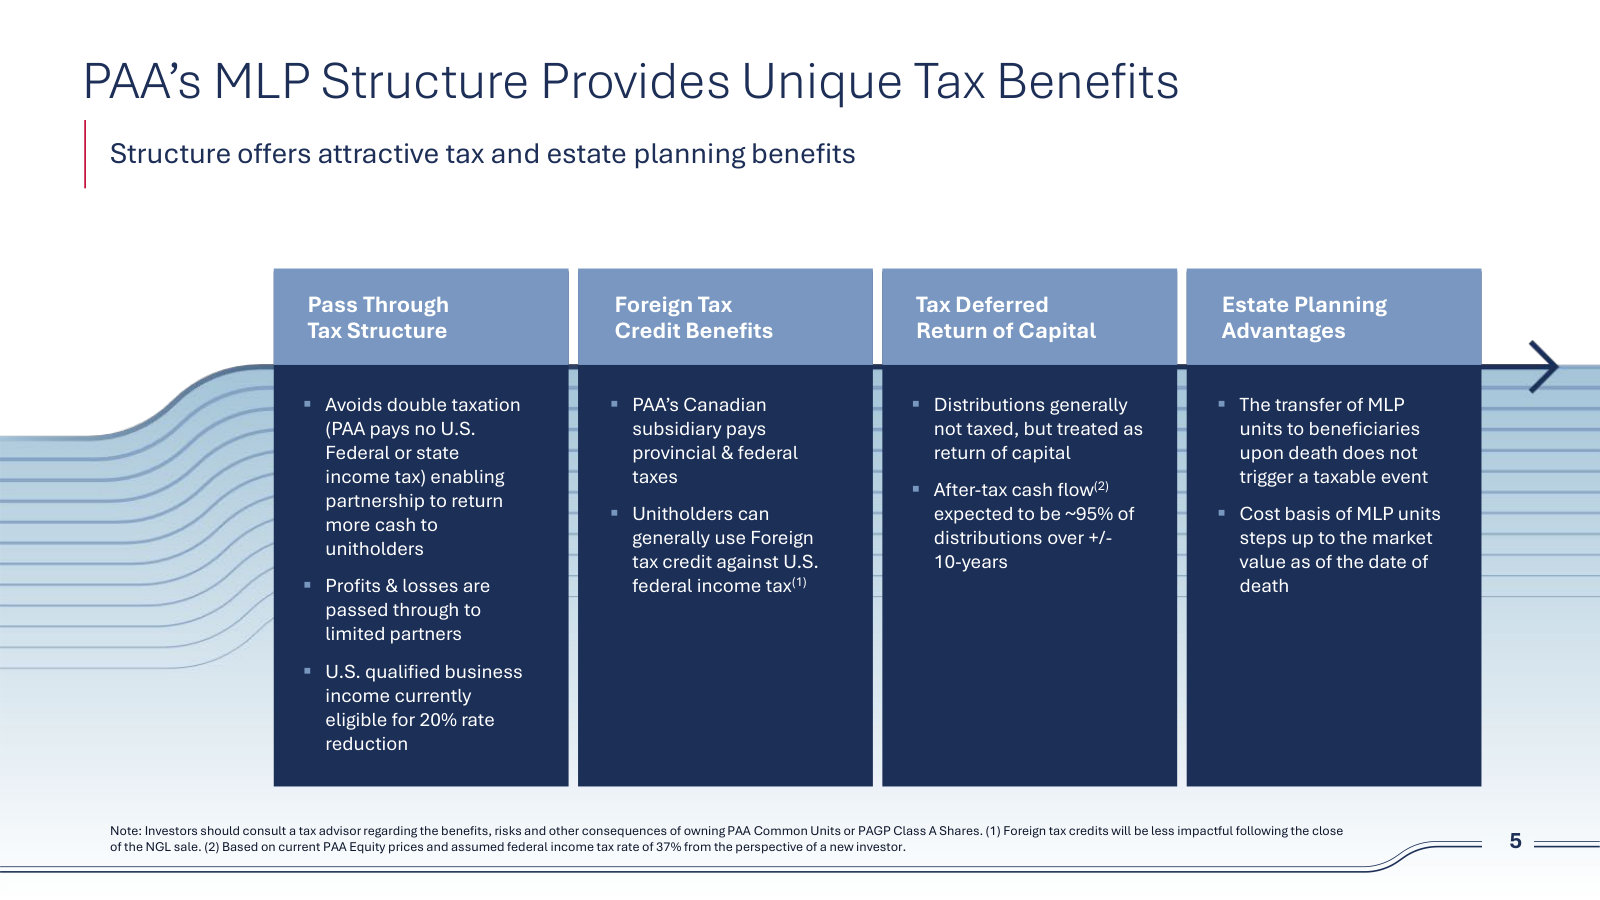
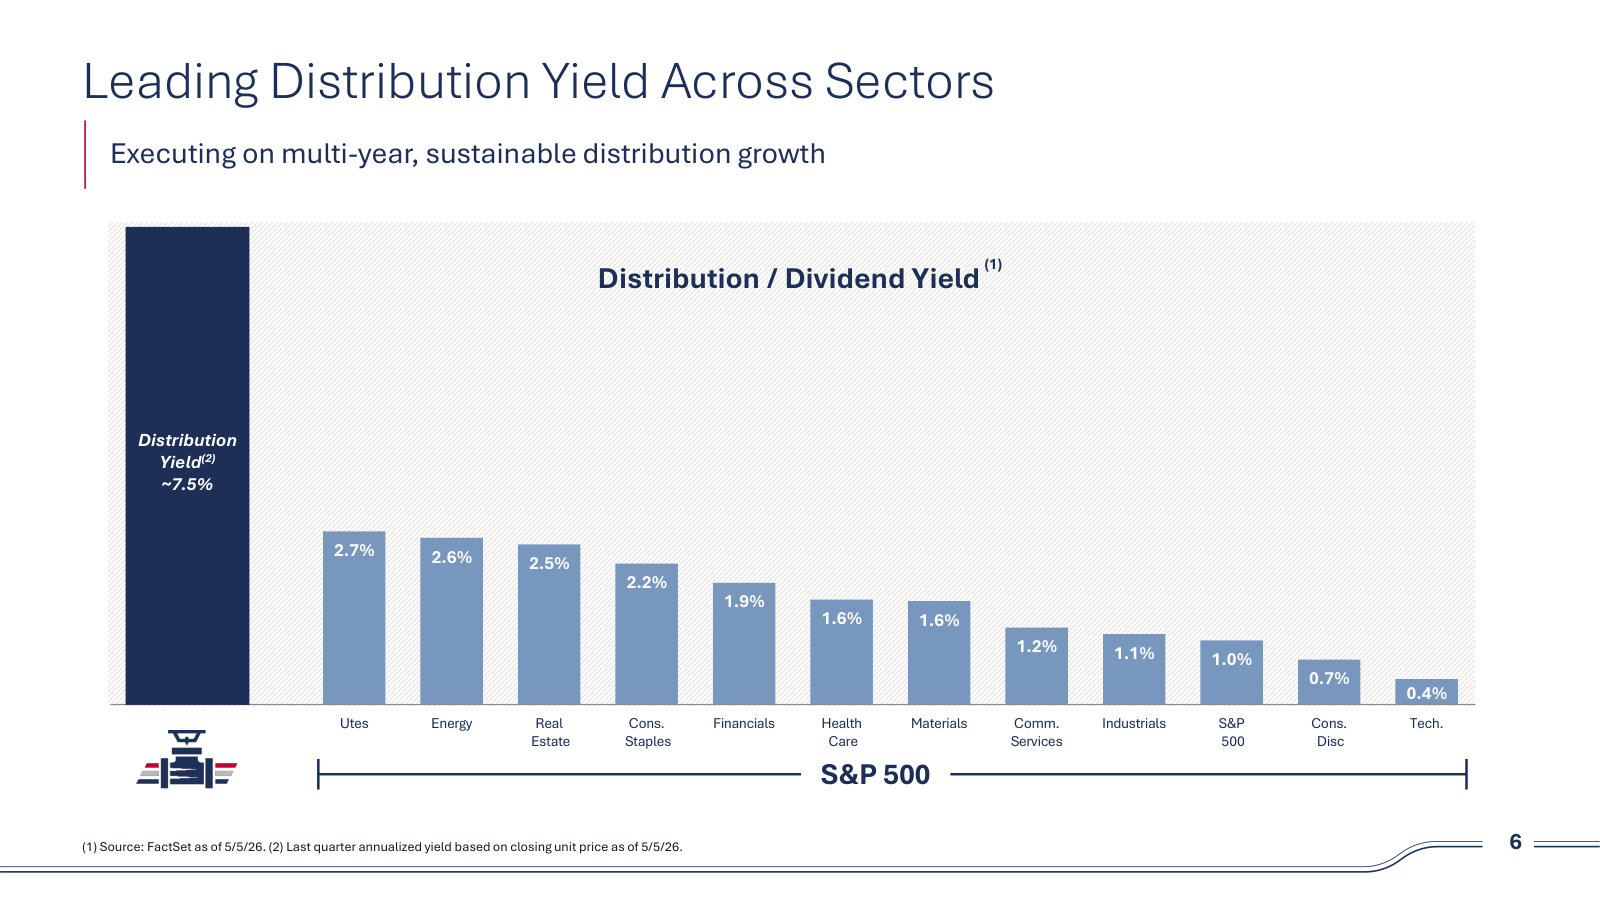
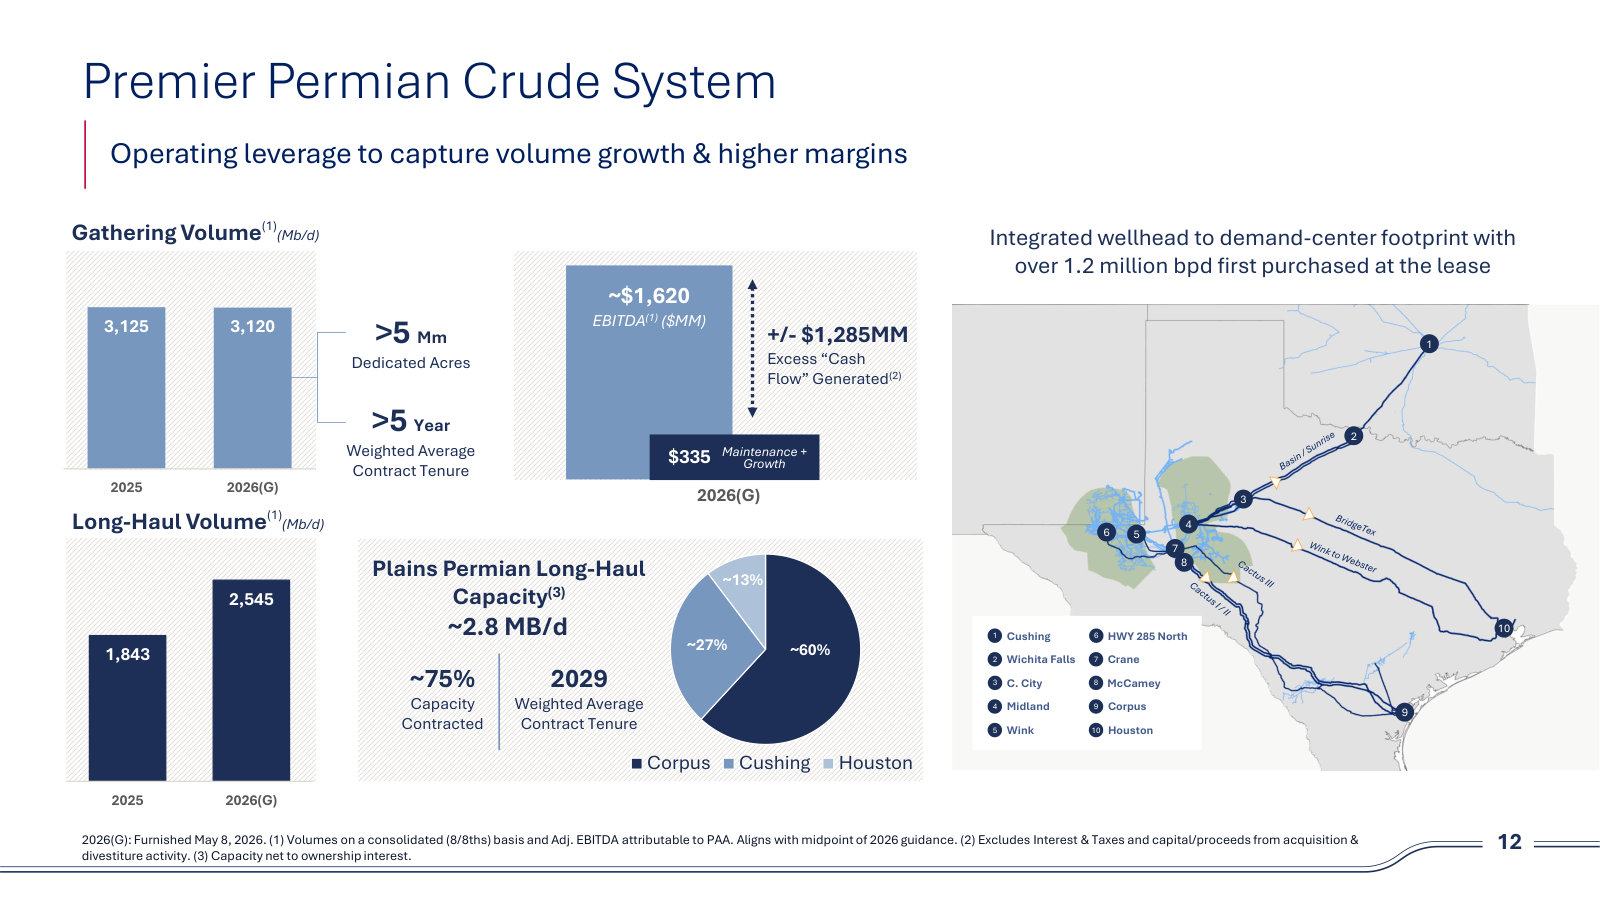
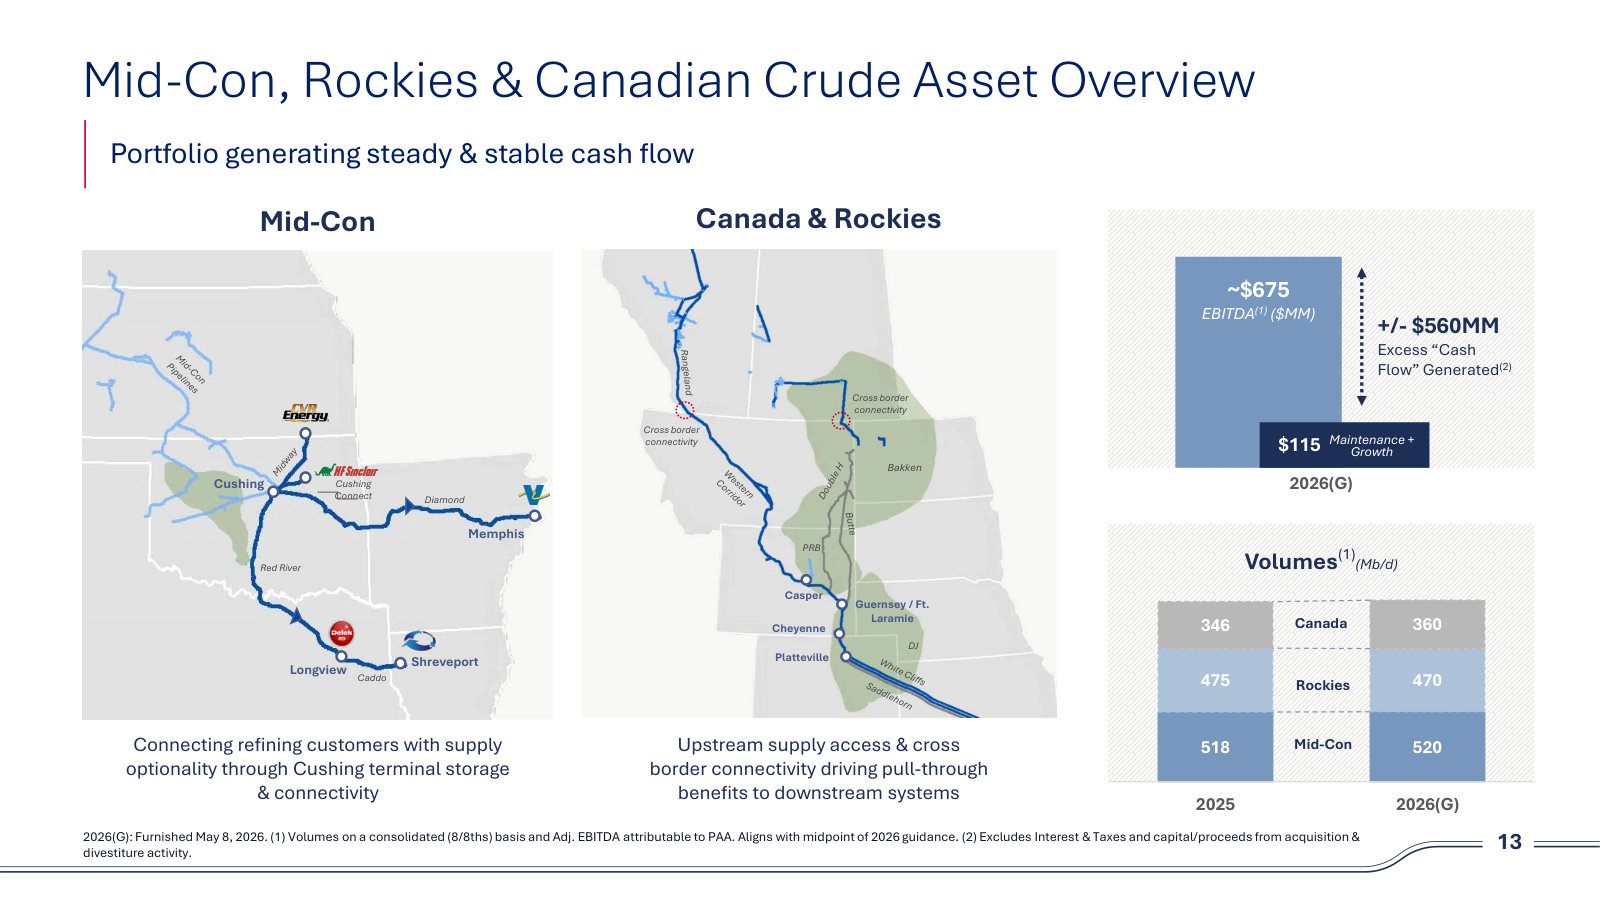
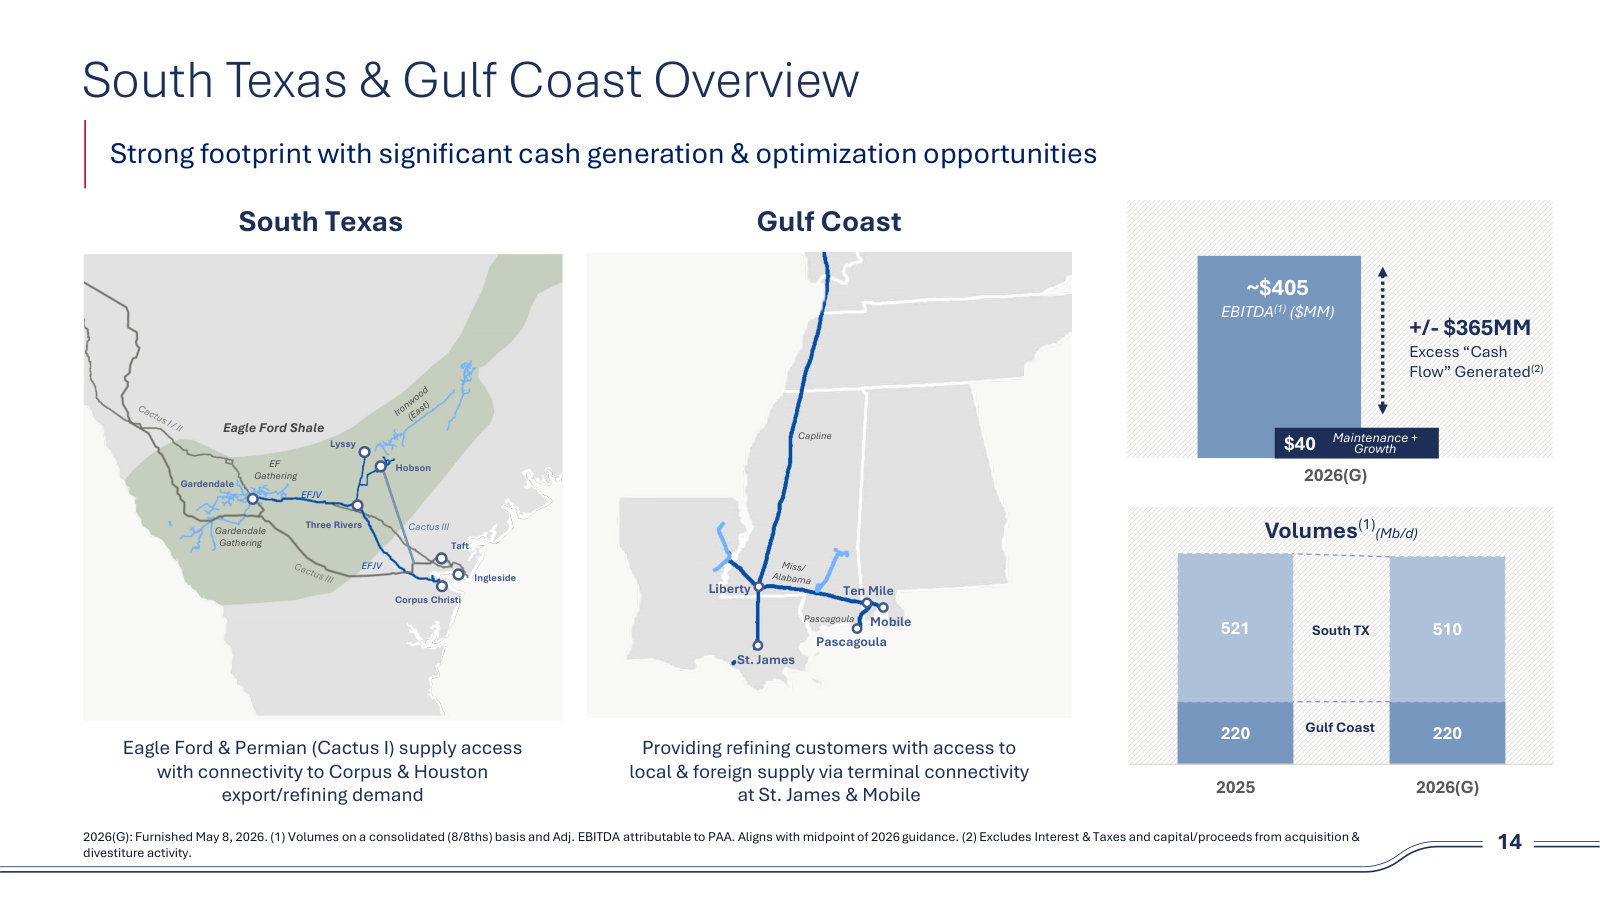
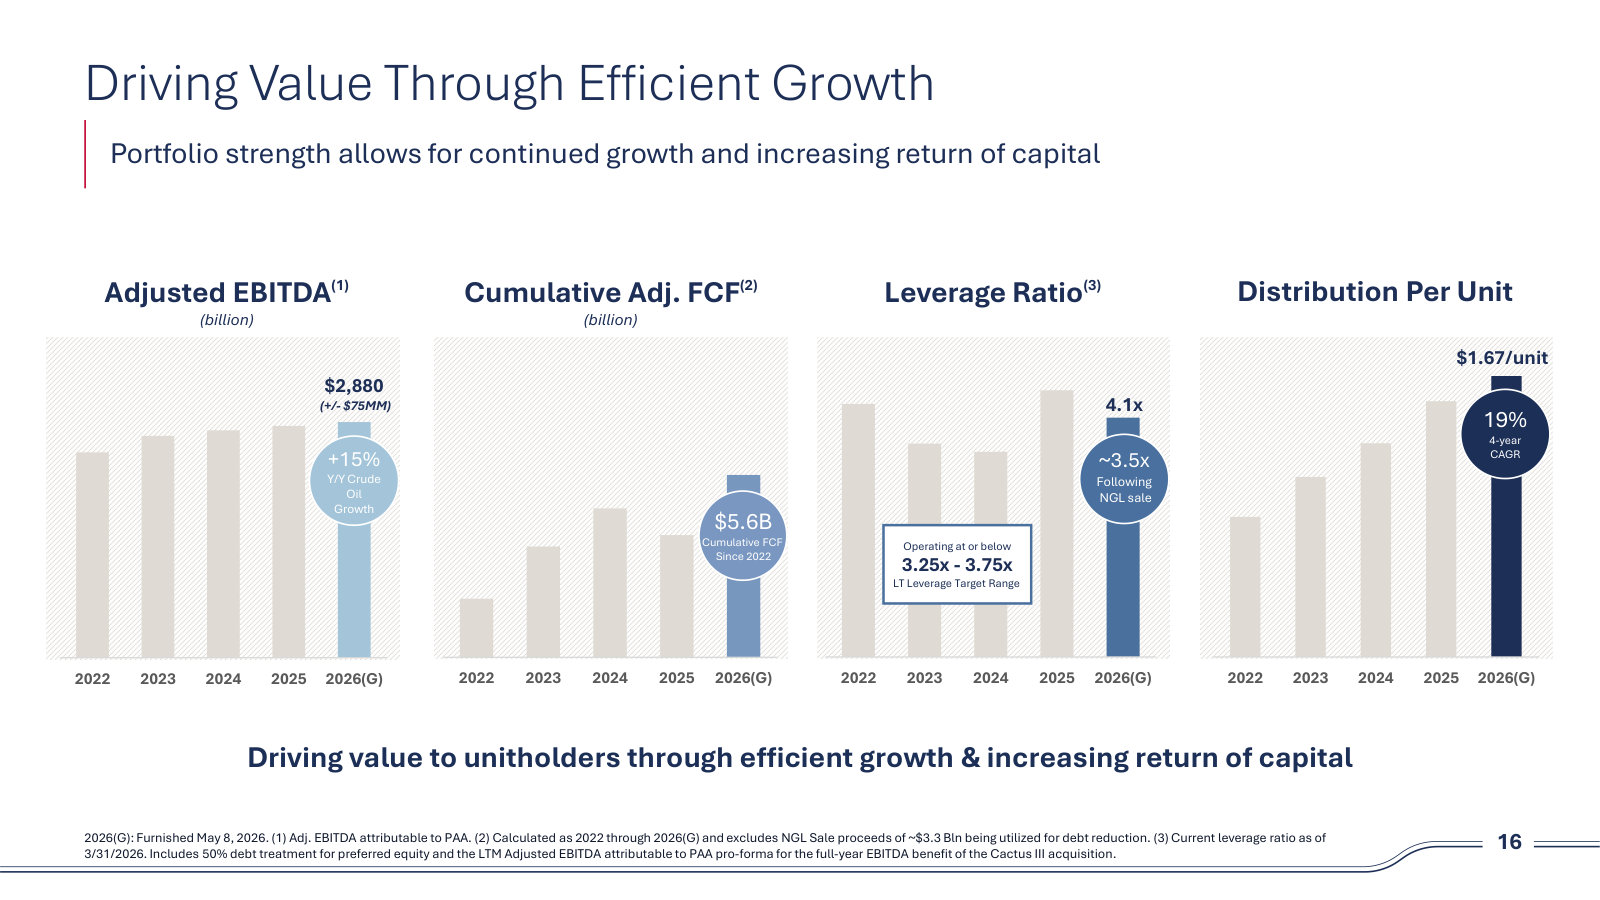
Plains GP Holdings, L.P.'s management explains the business in its own materials. The slides below do the most of that work, pulled from the documents preserved in Sources. Each source link opens the complete presentation at that slide in a new tab.
Investor Presentation — Second-Quarter 2026 — Second-Quarter 2026
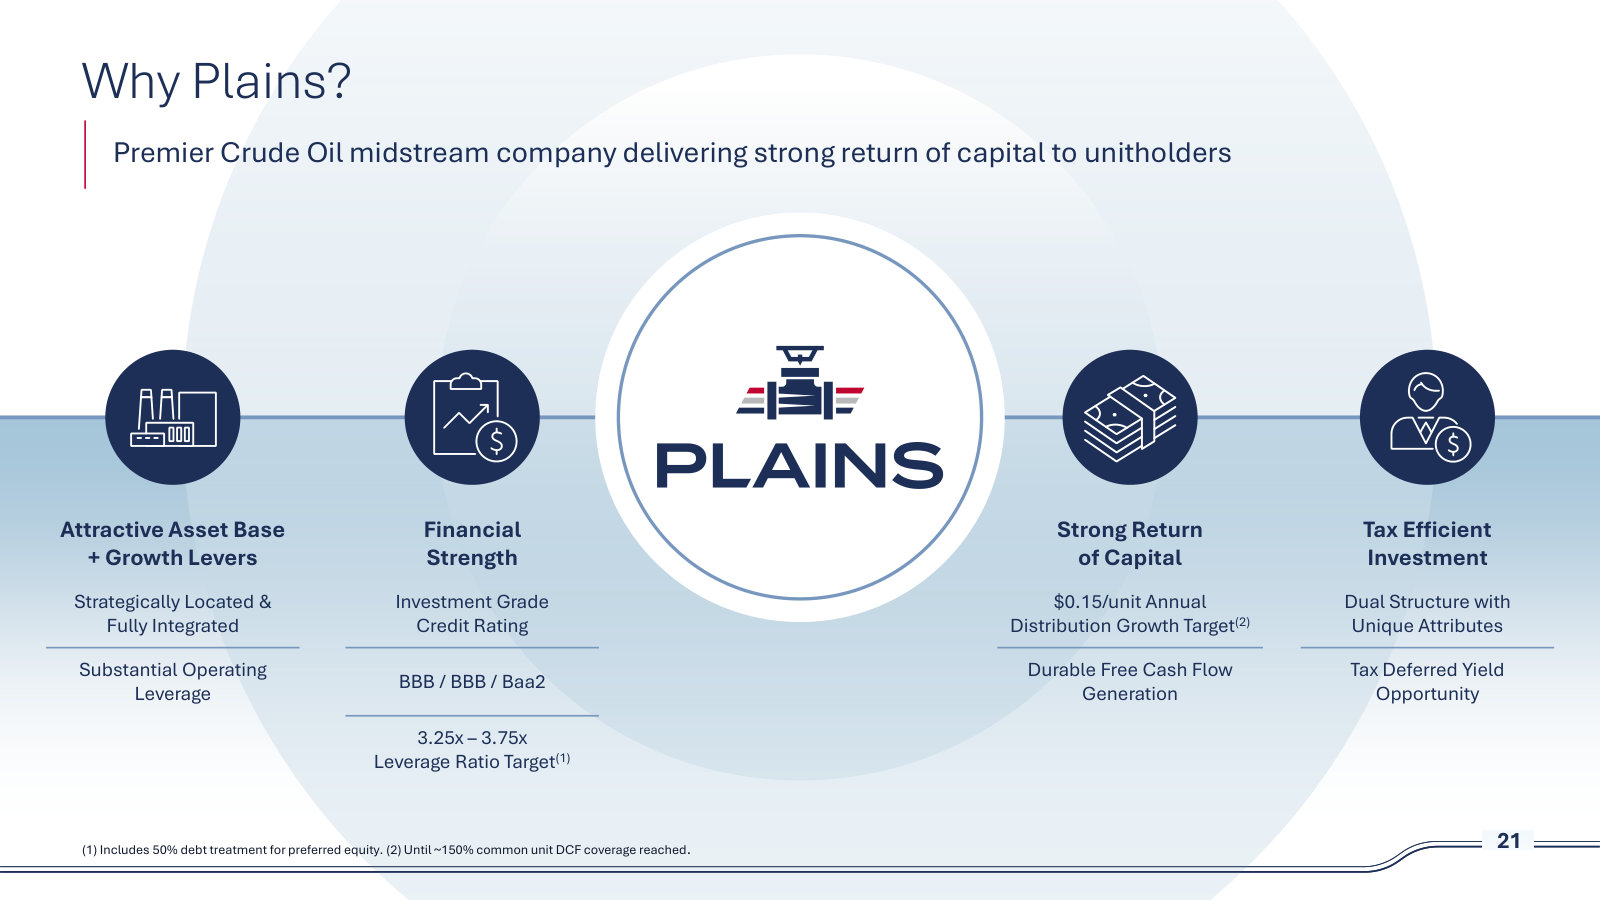
The standing company-overview deck: structure, the PAGP-vs-PAA tax question, asset maps by region, crude macro and the financial framework. · Open the full document →
1Q26 Earnings Call Presentation — 1Q 2026
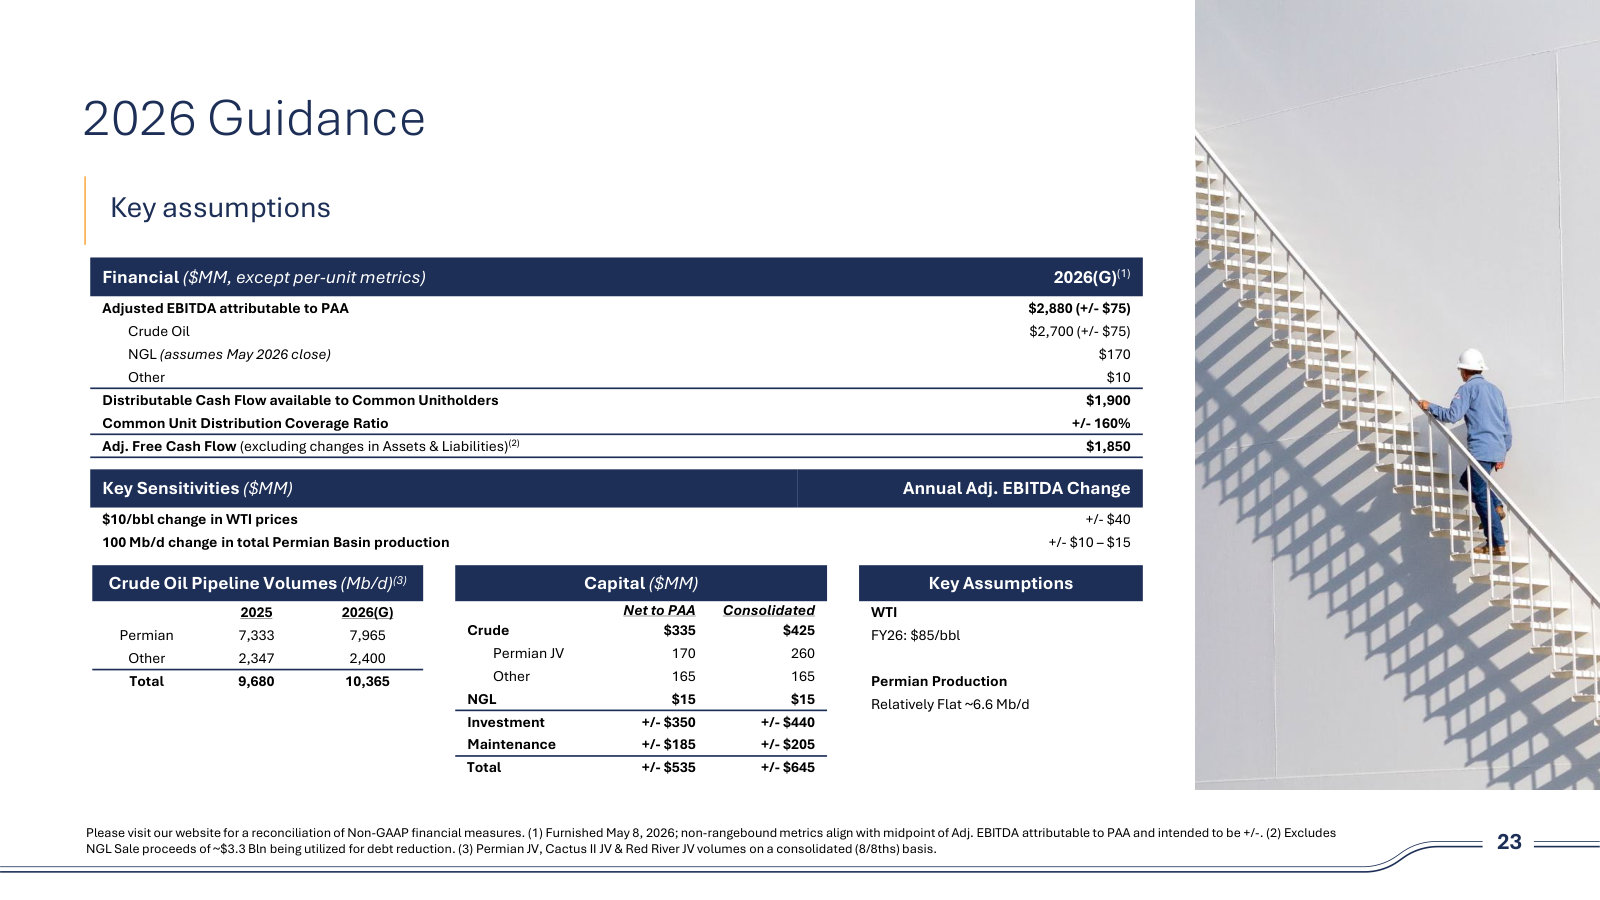
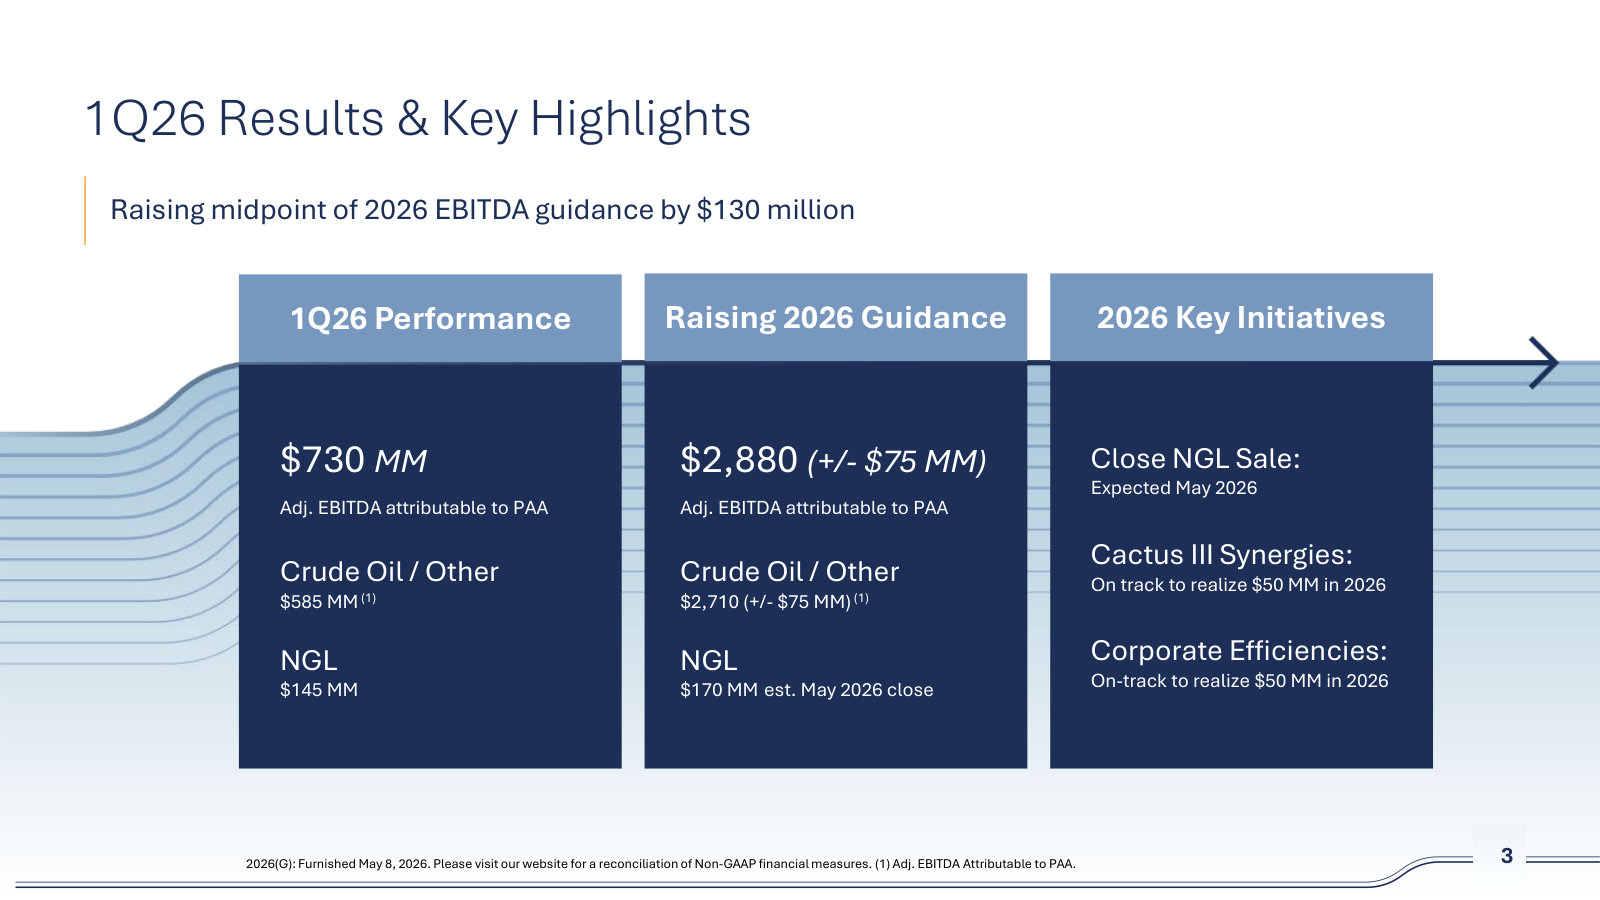
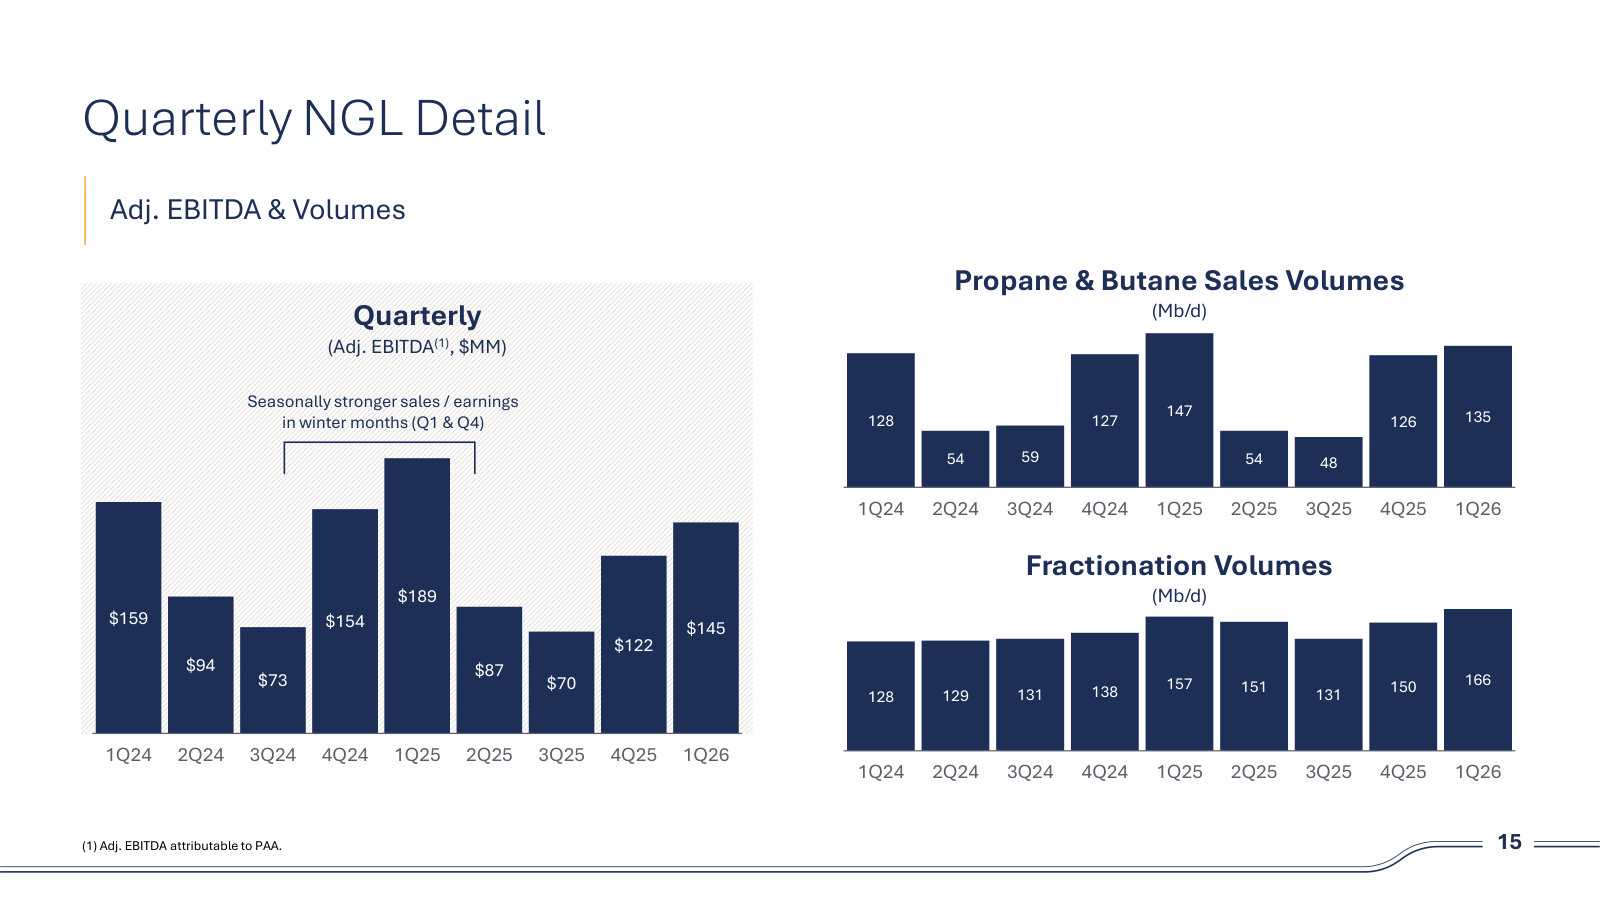
The most recent quarterly deck: current results, the raised 2026 guidance and the segment-level volume and EBITDA history. · Open the full document →
4Q25 Earnings Call Presentation — 4Q 2025
Where the 2026 plan was set out: initial guidance, the three strategic initiatives and the bridge from 2025 earnings. · Open the full document →
2Q25 Earnings Call Presentation — 2Q 2025
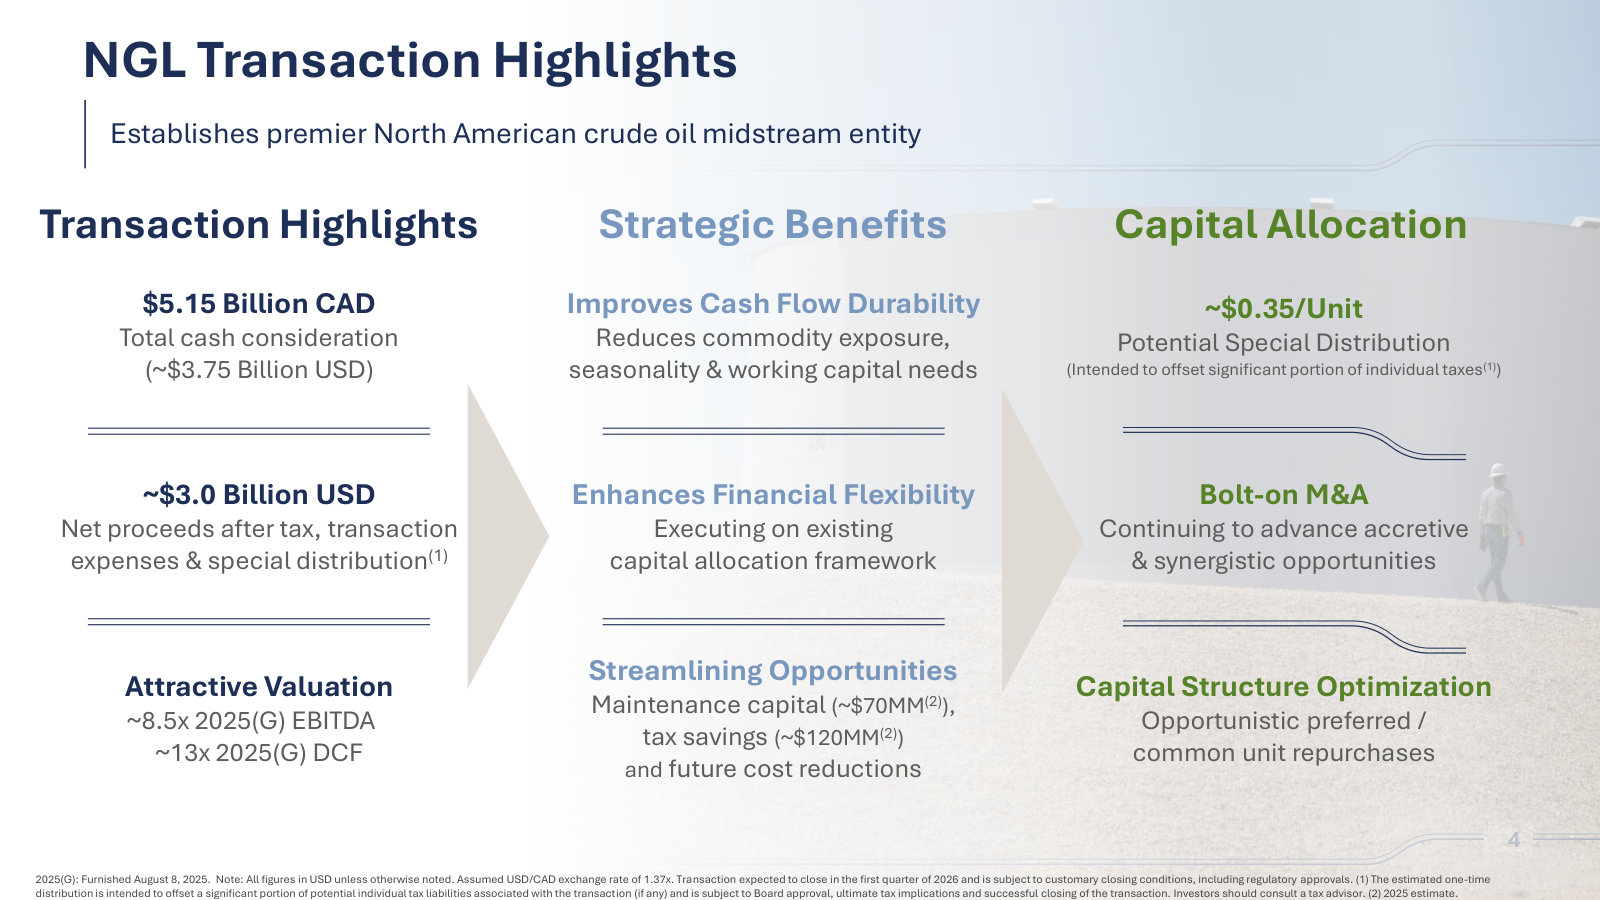
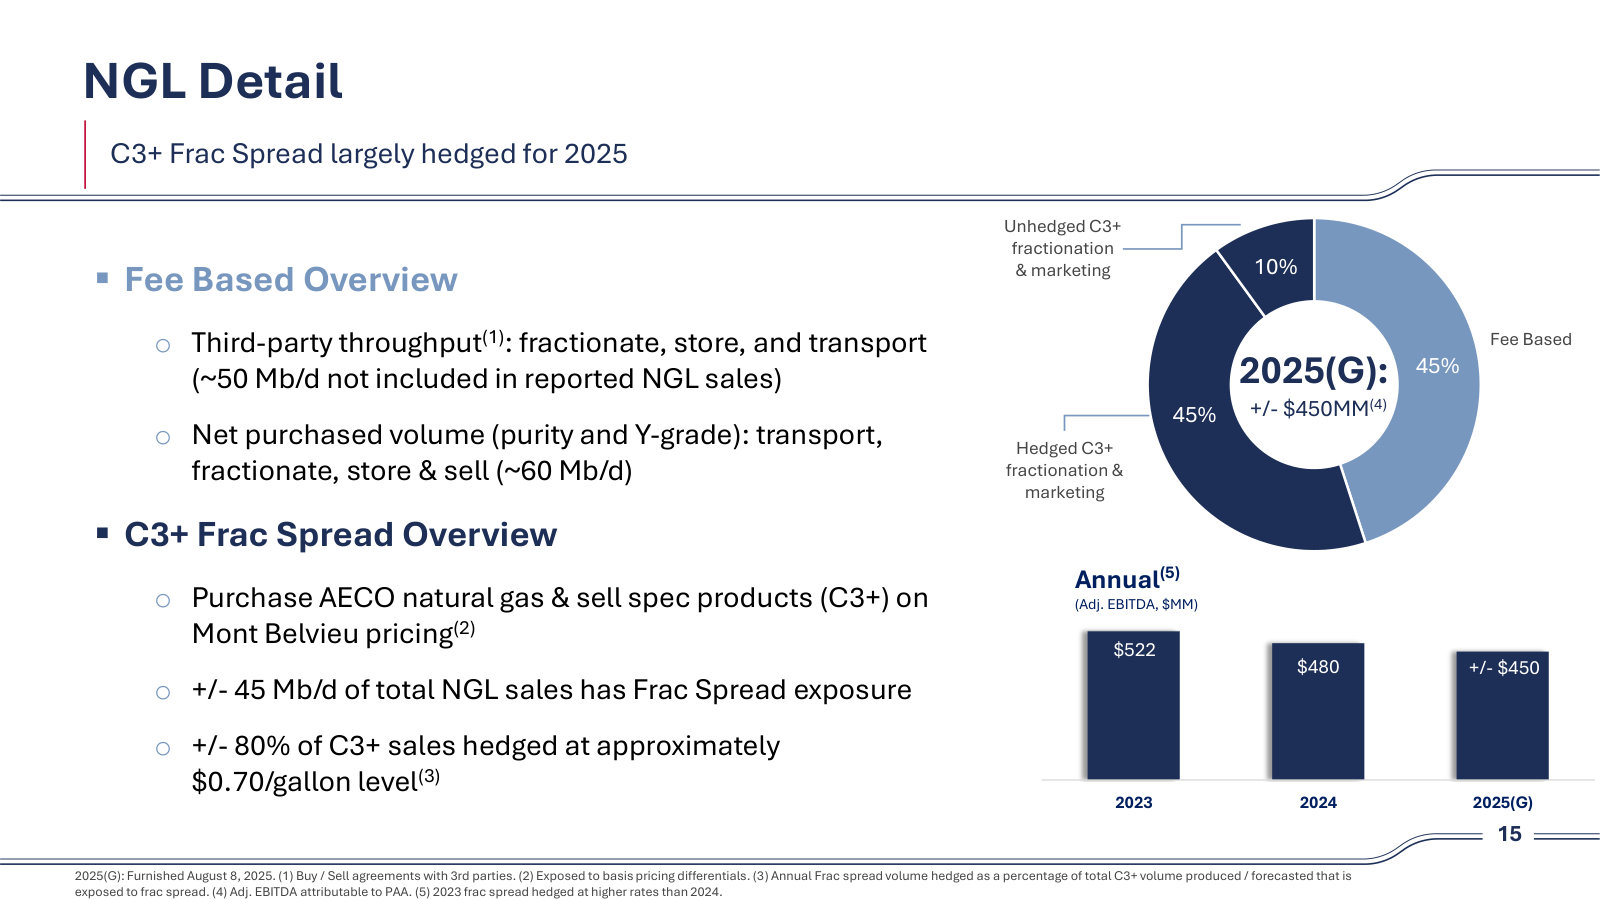
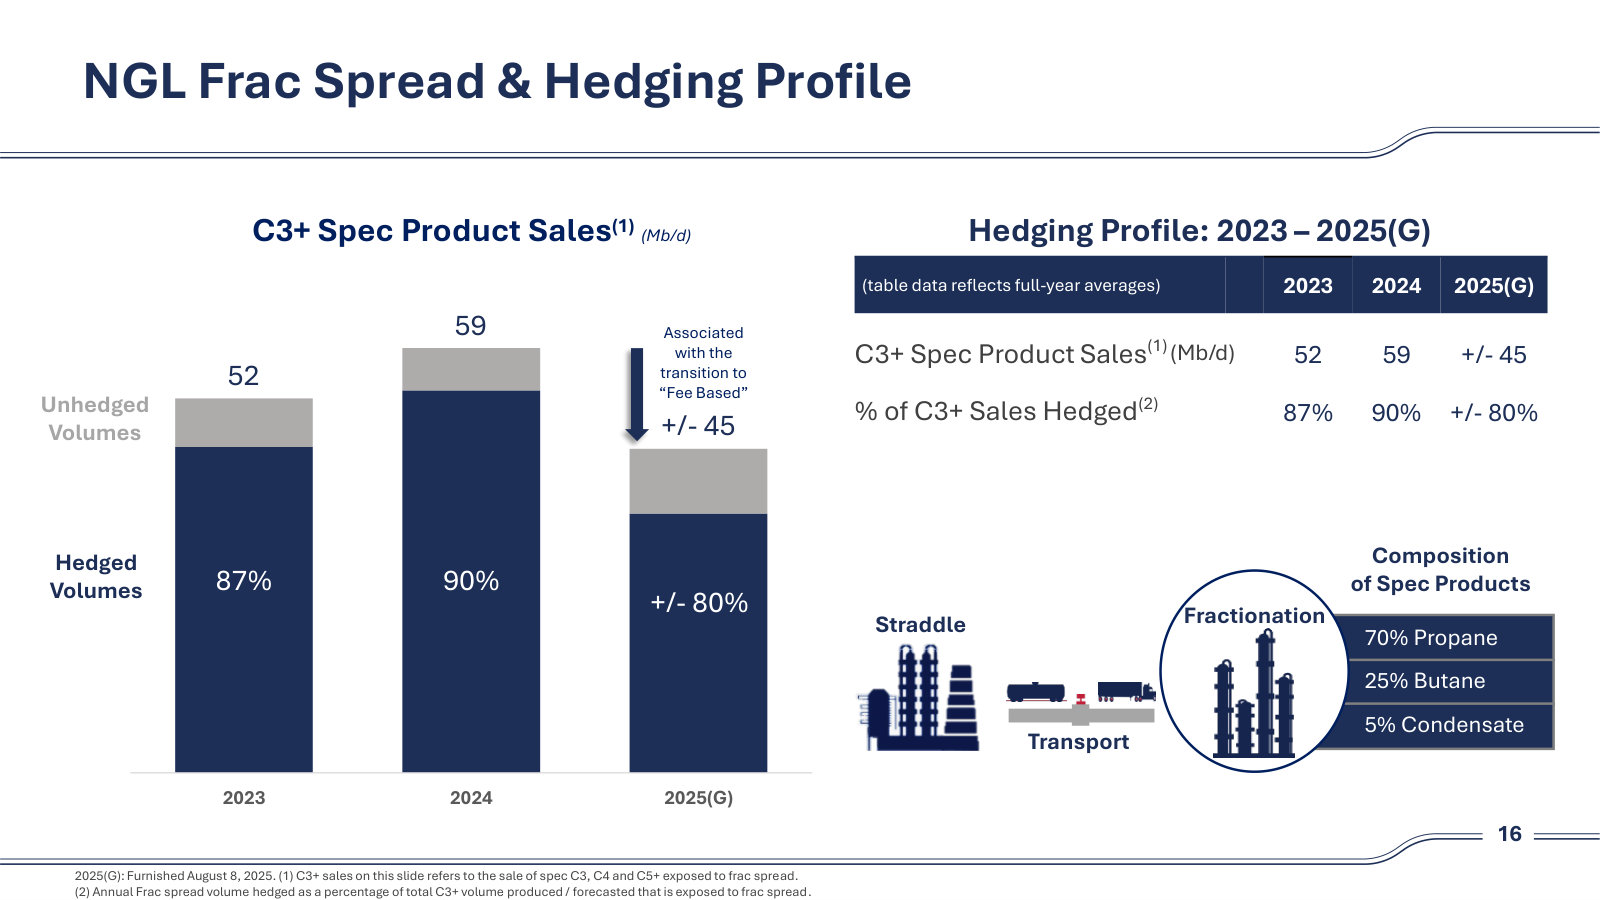
The deck that announced the NGL divestiture, and the last one that explains NGL unit economics before the segment leaves the story. · Open the full document →
More from management
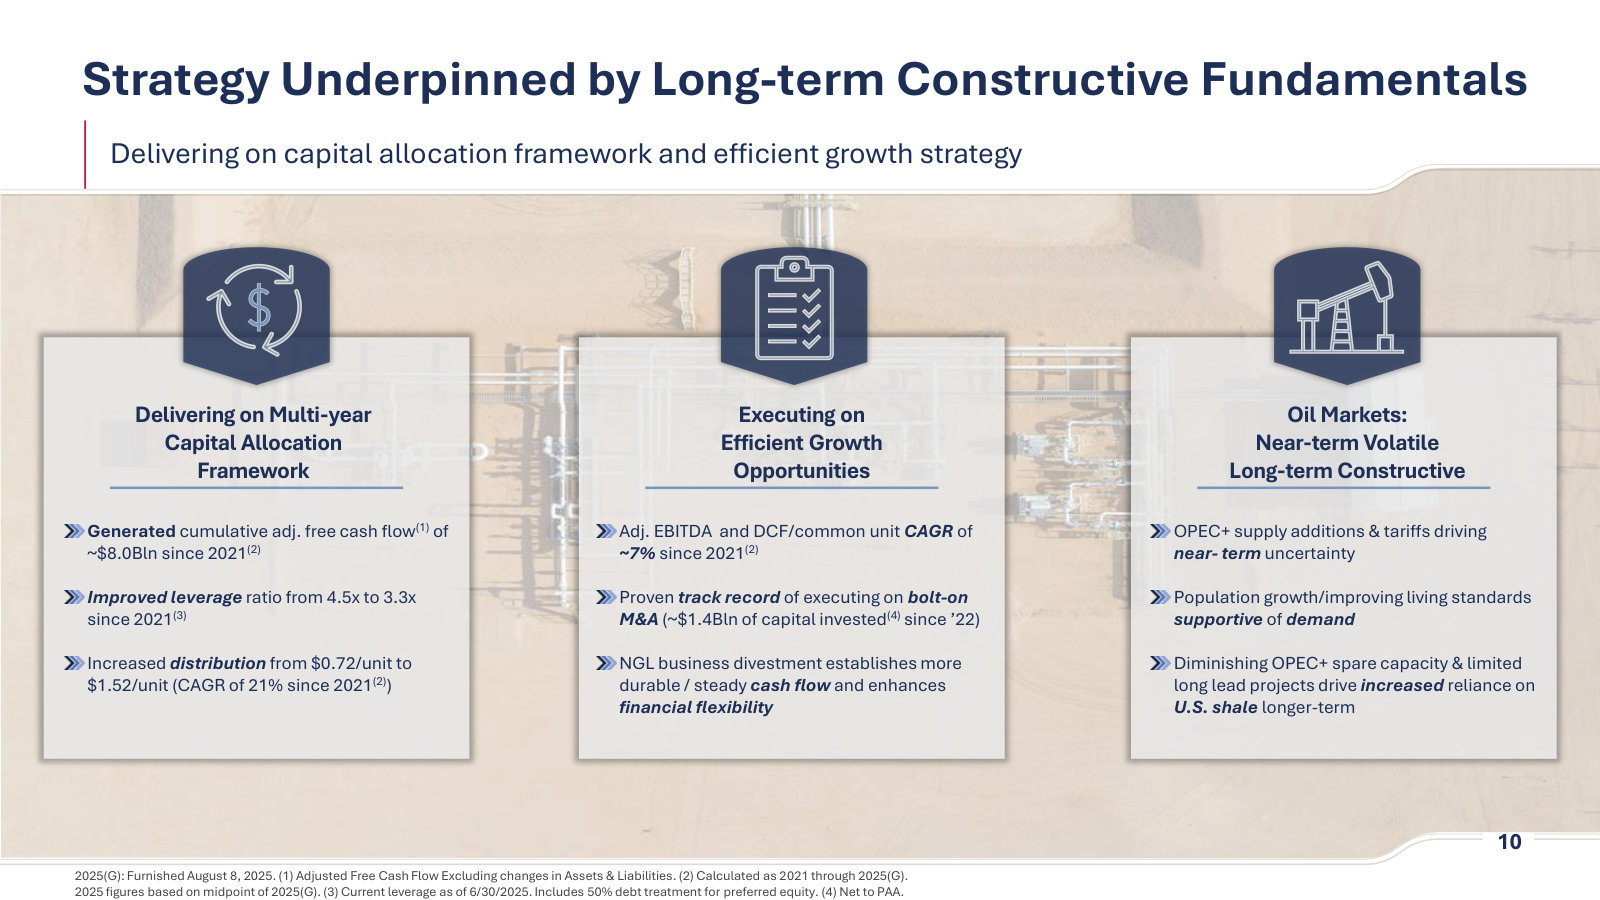
3Q25 Earnings Call Presentation — 3Q 2025 · 20 pages · The EPIC / Cactus III acquisition explained with the system map, plus the bar chart rebasing crude EBITDA for the pure-play transition. · Open →
1Q25 Earnings Call Presentation — 1Q 2025 · 21 pages · The quarter before the NGL sale was announced — the last clean look at the two-segment company under 2025 guidance. · Open →
4Q24 Earnings Call Presentation — 4Q 2024 · 24 pages · Permian production outlook and maps of the Ironwood and Midway bolt-ons — the clearest look at how a bolt-on gets justified. · Open →
4Q23 Earnings Call Presentation — 4Q 2023 · 24 pages · The 2024 guidance and capital allocation framework, a baseline for judging what this management has since delivered. · Open →
Plains GP Holdings, L.P.'s management answers for the business every quarter. These are the exchanges that explain it best — verbatim, from the call transcripts preserved in Sources. Each link opens the full transcript at that page in a new tab.
Q1 2026 Earnings Call — Q1 2026
The current state of the business: guidance raised on a war-shocked oil market, Cactus III synergies, and the capital allocation plan once the NGL sale closes. · Open the full transcript →
The macro case management underwrites: a war-driven destock now, an SPR restock later, scarcity value for pipe in the ground.
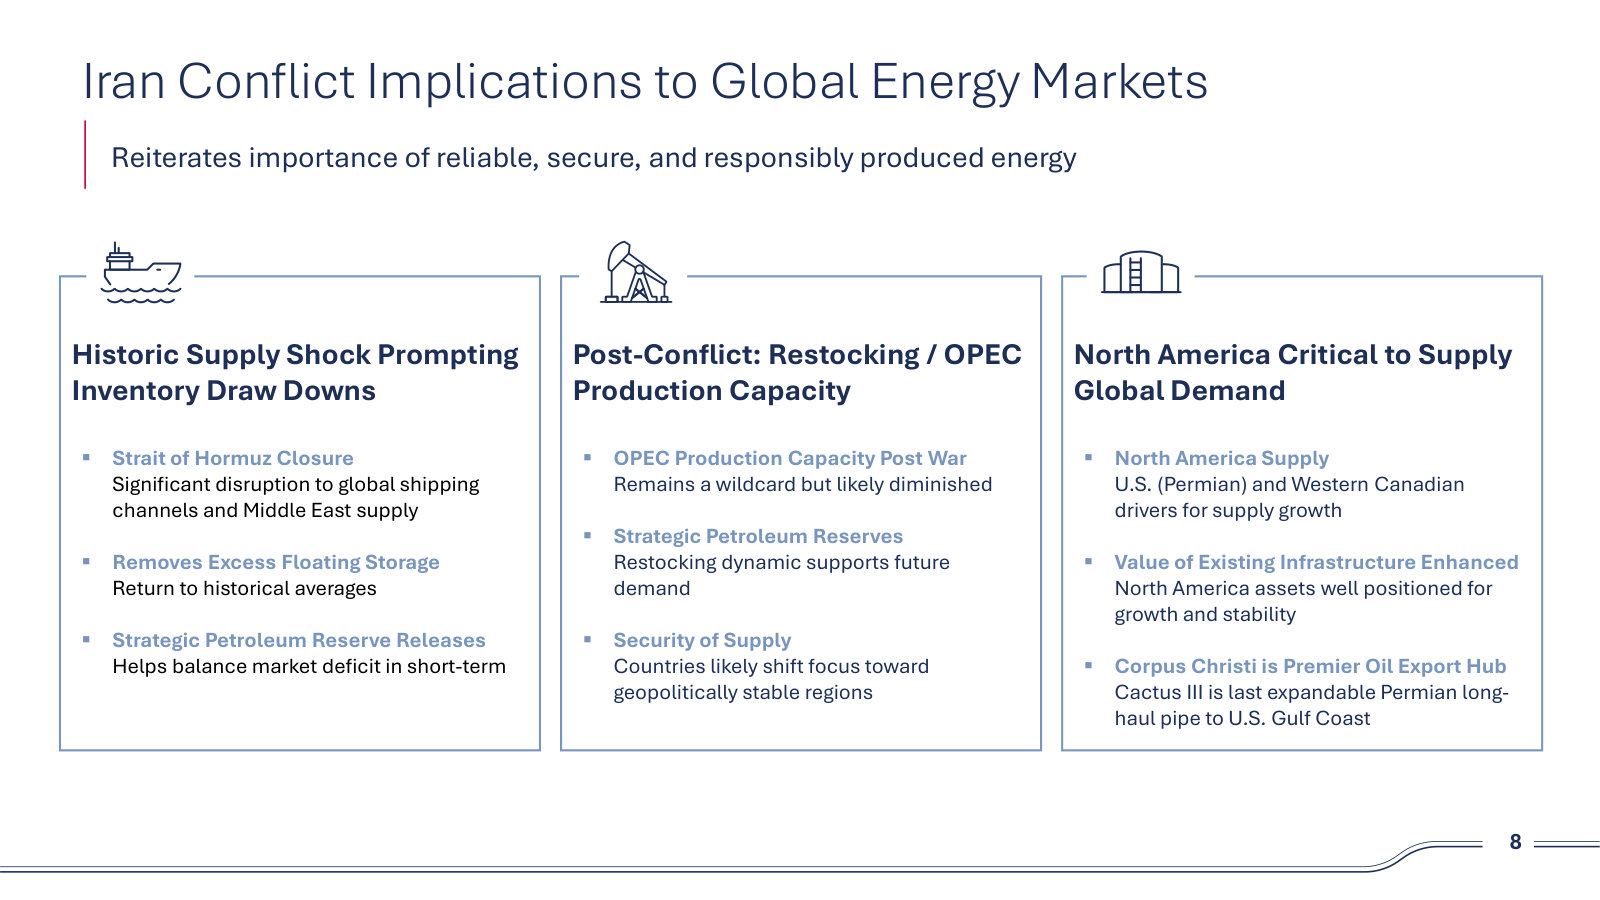
Willie Chiang (Chairman, CEO and President): Recent geopolitical events have reiterated the importance of reliable, secure, and responsibly produced energy. The closure of the Strait of Hormuz has significantly disrupted global shipping channels and Middle East supply, contributing to stronger commodity prices over the past couple of months. In response, excess floating storage has been drawn down, and strategic petroleum reserves are being released globally. While this helps balance the market deficit on a short-term basis, we are seeing a more constructive oil market developing on a longer-term basis. We expect this destocking environment to continue over the next number of months and ultimately drive a restocking phenomenon longer term as countries replenish depleted strategic petroleum reserves globally. Postwar, we would not be surprised to see several countries restock their SPRs above prewar levels, essentially creating an additional layer of demand into the future, which should support prices and incent producer activity. […] Against this backdrop, North America, including the Permian, remains well positioned to play a critical role in meeting global demand. As this occurs, the value of existing infrastructure in the ground should continue to increase over time.
p. 1 · Read in context →
Why the published crude-price sensitivity overstates the upside: the year was hedged before prices moved.
Brandon B. Bingham (Scotiabank); Al Swanson (Executive Vice President and CFO): Just wanted to ask on the new guide. If I look at your sensitivity and the new crude price expectations, it would imply that, at least on price movements alone, the crude contribution should probably be higher than what is currently shown. Could you just walk us through what is baked into the new guide and maybe the embedded outlook in there? […] Sure, Brandon. Yes, our original guidance for the year assumed a $60 to $65 environment for 2026, call it a $62 average. We came into the year highly hedged at roughly those levels. The $85 environment that we are talking about for the future is roughly the strip from June through December when we looked at it. So there would be some benefit based on crude prices on our PLA, but we had hedged quite a bit before entering the year. That sensitivity we give is just a raw sensitivity; in order to make it more meaningful, we would have had to have disclosed the hedge position at the beginning of the year, which we have not historically done. So what I would say is that the first quarter performance and the nine months of our guide are very minimally impacted by actual PLA pricing.
p. 3 · Read in context →
Where marketing margin actually comes from — time, location and quality spreads — and the 200-300 kb/d of Permian oil sitting behind pipe.
Jeremy L. Goebel (Chief Commercial Officer): Gabe, without getting into specific strategies—time, location, quality spreads and volatility —we benefit from all of those because we have the assets, the supply position, and the trading function to capture those opportunities. While it is hard to forecast those, when they arrive we can take advantage by, for example, selling a barrel now and buying it back later by emptying a tank, or capturing differences in grades between Canada and the United States and across Gulf Coast grades. We are excited about those opportunities. What we have put in the forecast has been substantially captured. It is a very volatile time period; we have only been in this 60 to 70 days, so it is hard to forecast that to continue. […] We also estimate there is close to 200,000 to 300,000 barrels per day of oil behind pipe in the Permian Basin. That flush production is substantial, and a lot of that is in the more constrained areas of the Delaware Basin, where we have a broader footprint, including New Mexico and other places. If you look at the Waha spread, flat price in Waha has been largely negative since last September; that is what is accumulating all of this behind pipe. As gas prices recover, productive capacity is already there to add. As you add more, that puts more pressure on potentially long-haul spreads and the ability to term up contracts at greater rates. We are seeing more demand from new customers, and we are seeing potentially flushed production. Those should all help convert short-term opportunities into longer-term opportunities.
p. 4 · Read in context →
Weather volumes are gone for good; minimum-volume-commitment shortfalls are only a timing item that reverses.
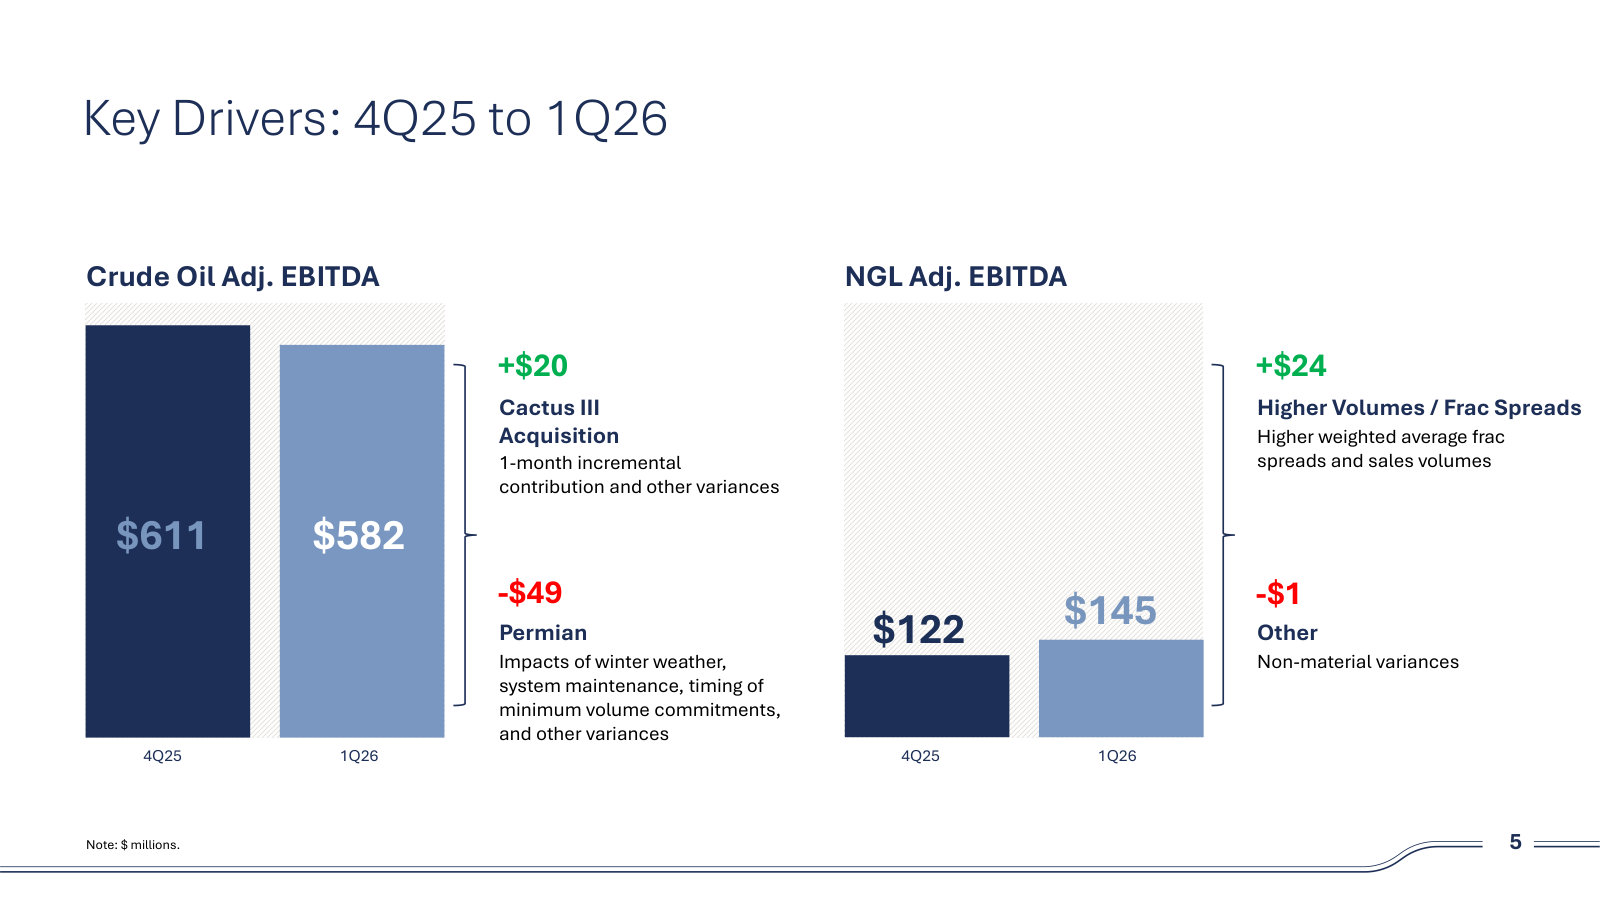
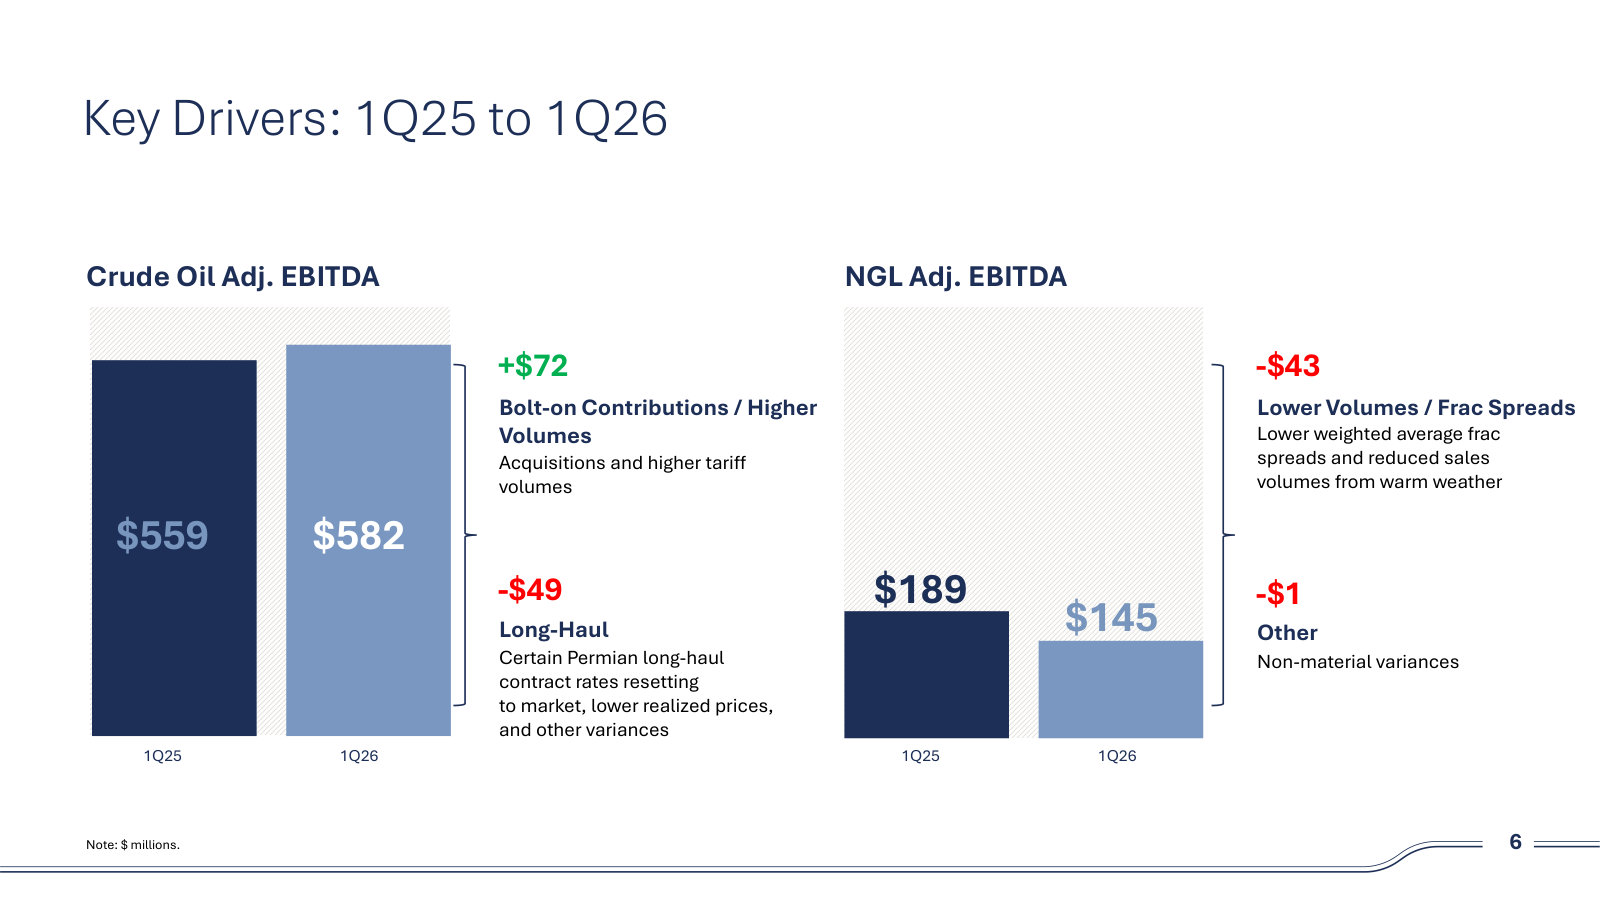
Al Swanson (Executive Vice President and CFO): Yes, Manav. Those are two different things. First, with regard to weather, weather is just production shut in for a period. You cannot make that back, but the flush production does come back. With regard to the timing of MVCs, that is continuous in our process. If you look at some of the earnings calls from others about their dock performance or other things in the first quarter, freight was really expensive and margins did not have people moving, so longhaul volumes were down across the industry. But that has completely reversed in timing, so you would absolutely expect that to be recovered. It is just a question of those MVCs accrued versus when they are paid. All the pipelines are full again, and the MVCs are being reversed. If you are referring to slide five, there are a bunch of one-time events in that negative $49 million that will not occur again as we go forward.
p. 5 · Read in context →
Cactus III expansion is phased against contracted demand rather than one binary capital decision.
Willie Chiang (Chairman, CEO and President): On Cactus III, we have expansion capacity. As we have always said, we will pace that with market demand and commercial contracts. As we have gotten to know the project and assessed it, we have the ability to do that in a phased approach. It is fairly flexible for us to get additional volumes; it is not a binary big expansion. There are ways to do it in phases which should match customer demand. Generally speaking, in a higher price environment, there are more opportunities because there is a pull on the whole system. In that kind of market, market and optimization opportunities become more prevalent versus a lower price environment where less is moving and there are fewer opportunities.
p. 6 · Read in context →
The post-divestiture capital allocation stack, in priority order, and the debt paydown that precedes it.
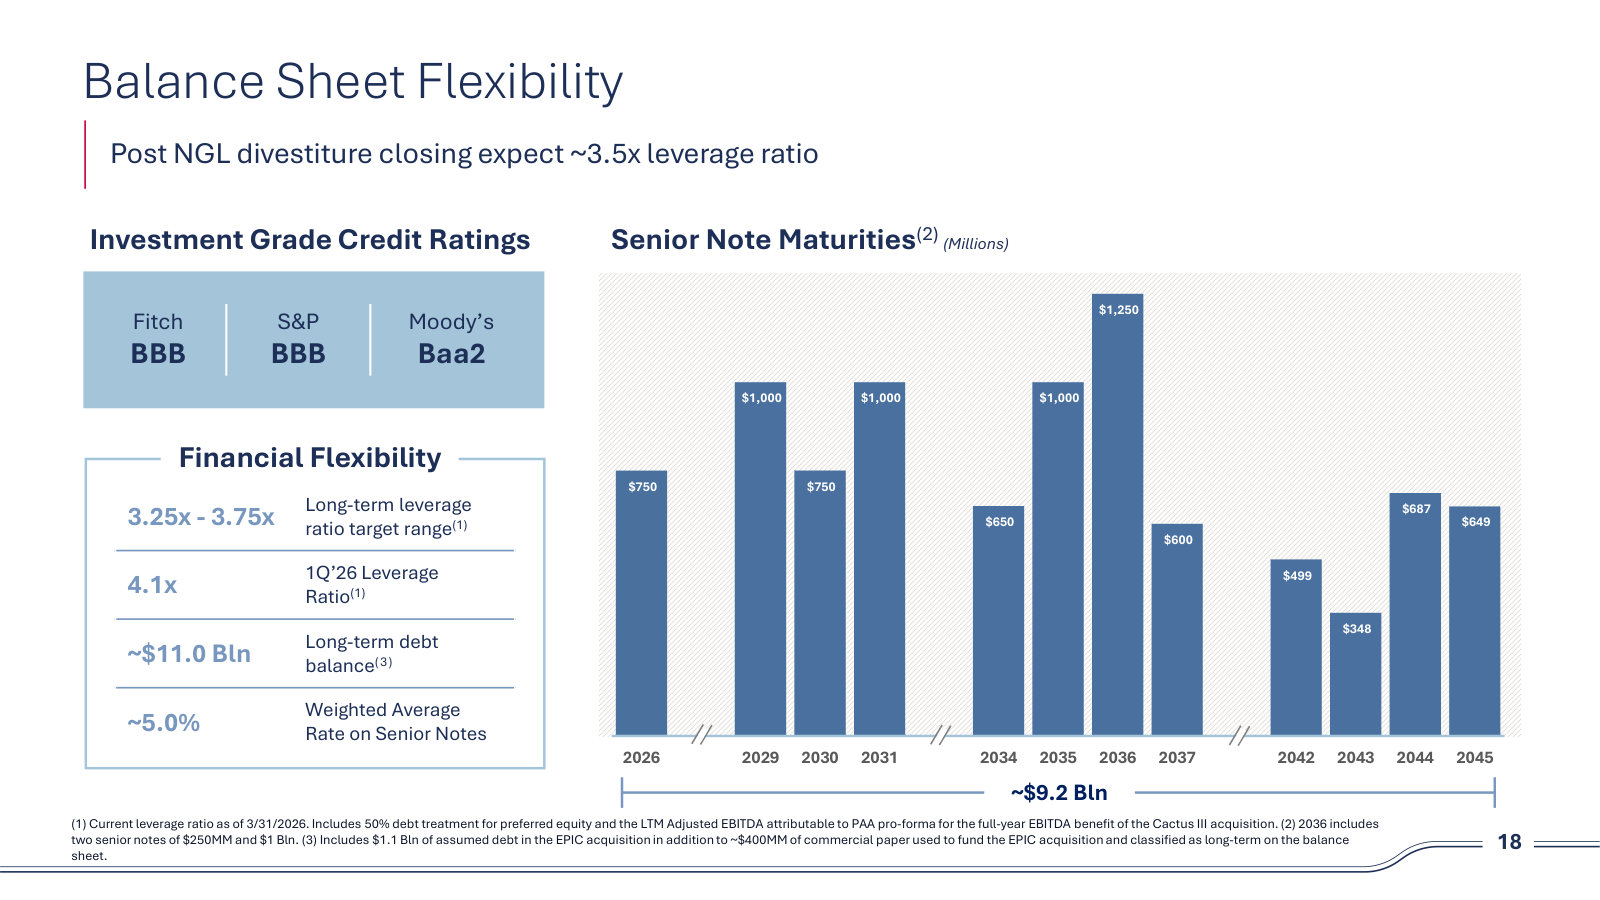
Al Swanson (Executive Vice President and CFO): On capital allocation, with the proceeds from NGL, we anticipate paying down a little over $3 billion of debt, which would be the term loan, the outstanding CP we have, and a $750 million note that matures later this year. Post that, we expect to be right at the midpoint of our leverage range, about 3.5x, and expect that to migrate down toward the low end, which will put us back where we were for several years prior to the EPIC acquisition—leverage toward the low end of our range. Our capital allocation priorities remain: maintaining distribution growth; funding investments, whether organic or M&A-related; taking out preferreds should leverage remain at or below the bottom end of the range; and opportunistic share repurchases. So once we get through the NGL sale and deploy the proceeds, we return to the framework we have been operating under for the last several years.
p. 7 · Read in context →
Q4 2025 Earnings Call — Q4 2025
The strategy-setting call: 2026 guidance, the coverage-ratio reset to 150%, the $100 million self-help program, and a walk through the non-Permian half of the asset base. · Open the full transcript →
The three-part 2026 plan — close the NGL sale, integrate Cactus III, take out $100 million of cost — stated as the whole strategy.
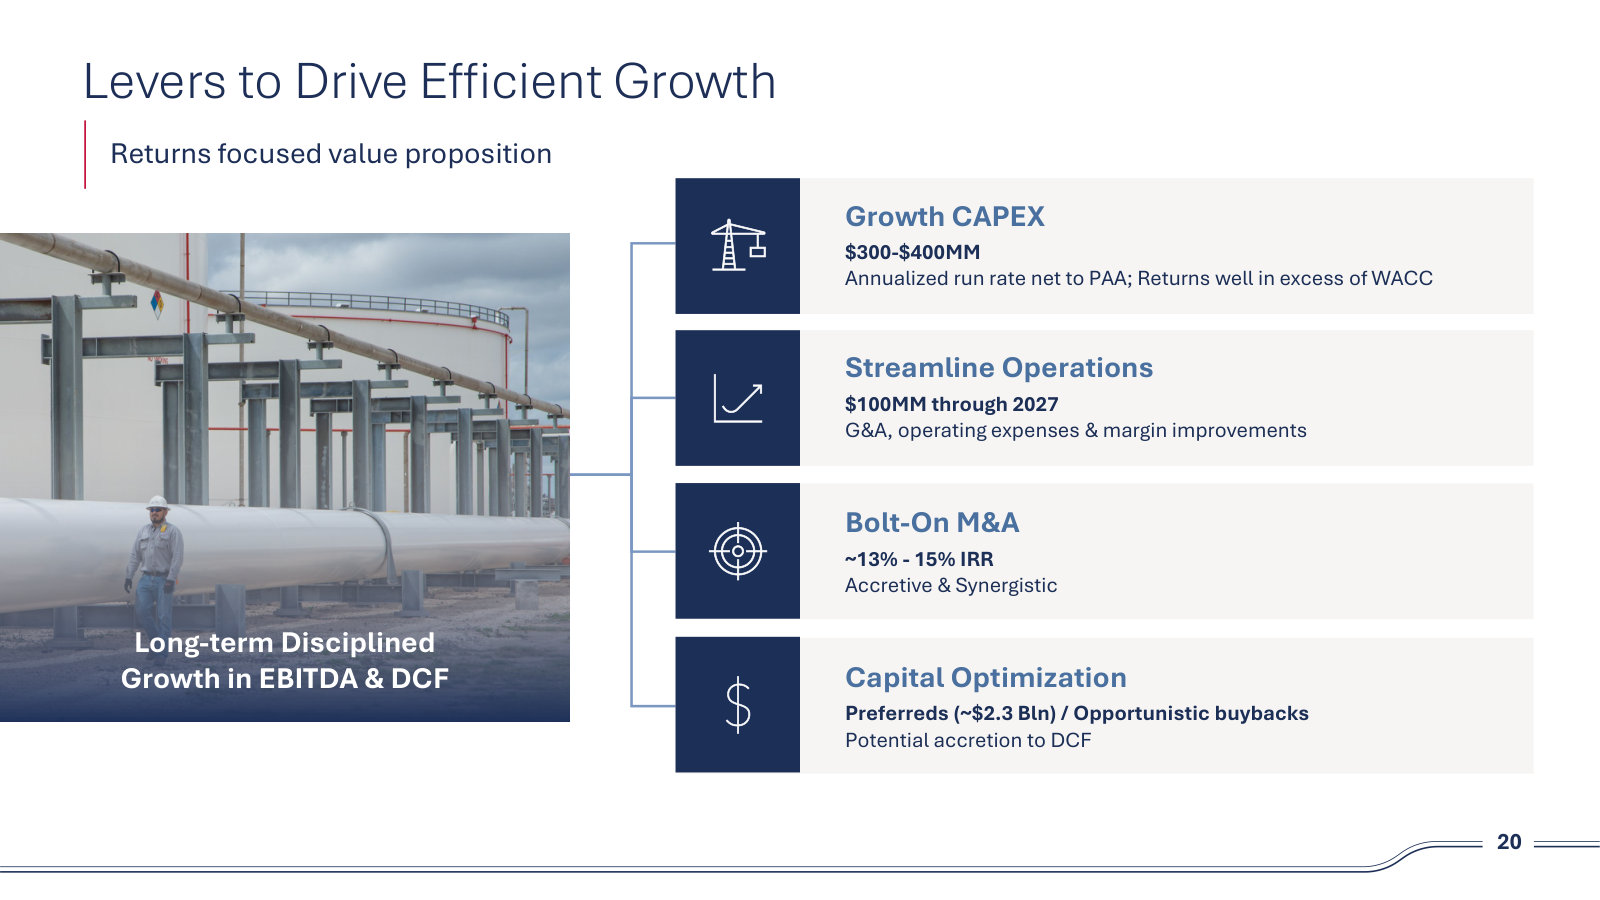
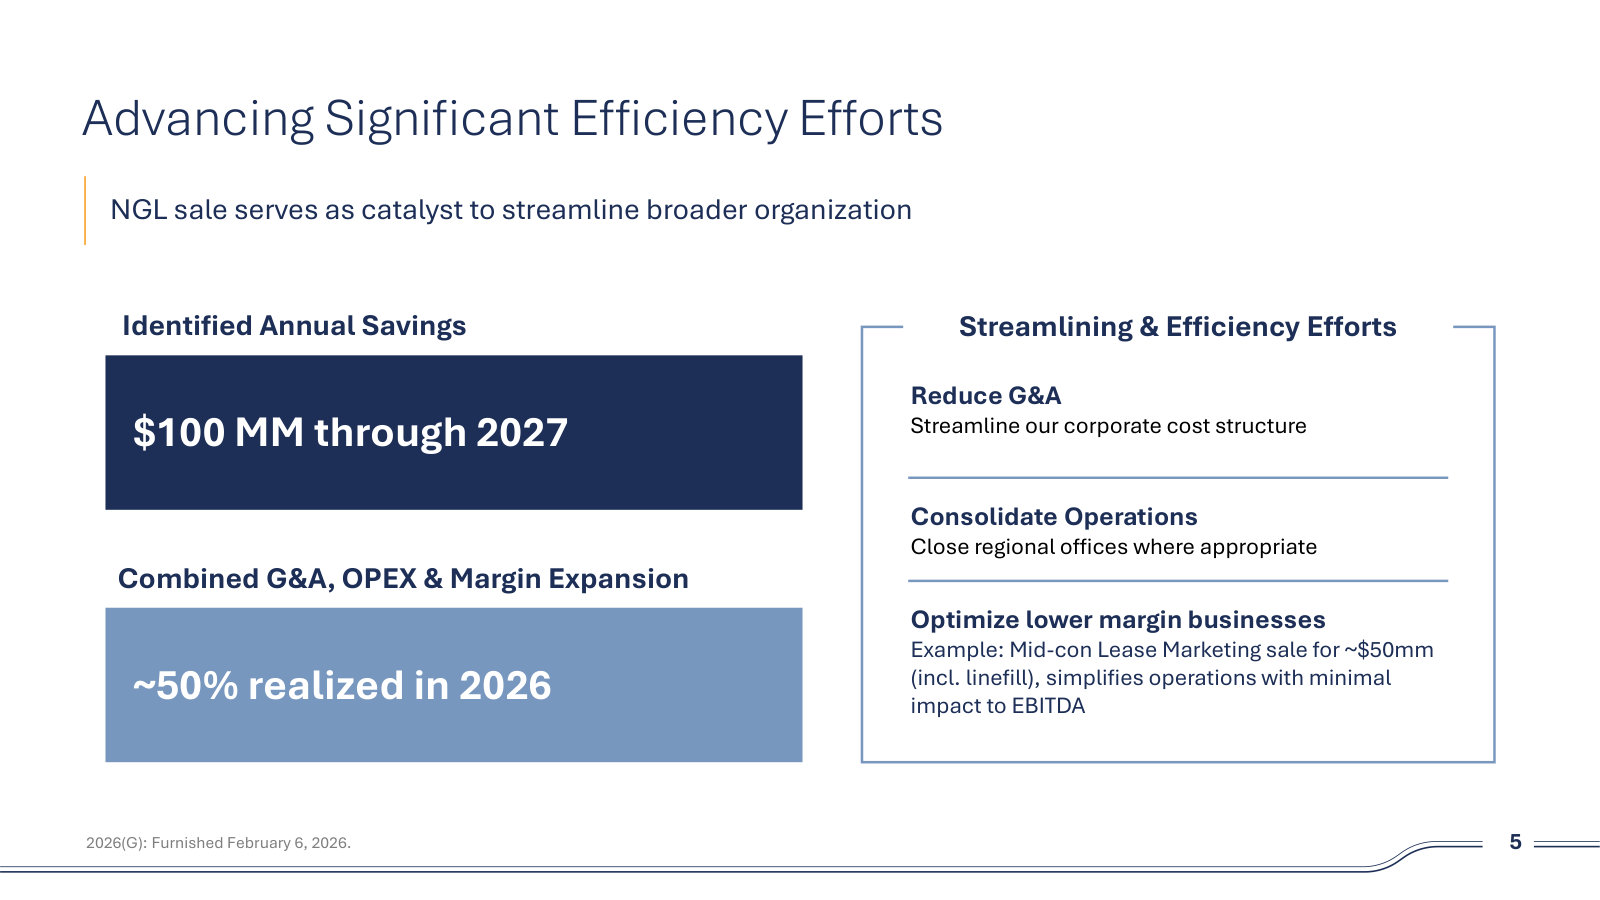
Wilfred C.W. Chiang (Chairman and CEO): 2025 was a pivotal year for Plains. The market environment presented multiple challenges, including geopolitical unrest, actions from OPEC to increase oil supply, and uncertainty on the economic impact from tariffs. As highlighted on Slide four, despite these distractions, we remain focused on transitioning to a pure-play crude company, which also serves as a catalyst to streamline our operations and better position Plains for the future. This transition is accelerated through the sale of our NGL business, along with the recent acquisition of the EPIC pipeline, now renamed Cactus III. These transactions enhance the quality and durability of our cash flow stream while improving distributable cash flow and positioning us well for future market cycles. 2026 will be a year of execution and self-help, with a focus on three initiatives. First, we remain on schedule to close the NGL divestiture near the end of the first quarter, pending Canadian Competition Bureau approval. Second, we are integrating the recently acquired Cactus III pipeline and expect to drive synergies related to that system to improve EBITDA. And third, we are streamlining the organization with a focus on efficiency, improving our cost structure. […] Over the past several months, we have advanced our streamlining initiatives and are targeting $100 million of identified annual savings through 2027, with approximately 50% expected to be realized in 2026.
p. 1 · Read in context →
Selling the NGL segment lowers EBITDA but raises distributable cash flow — the distinction that drives the distribution.
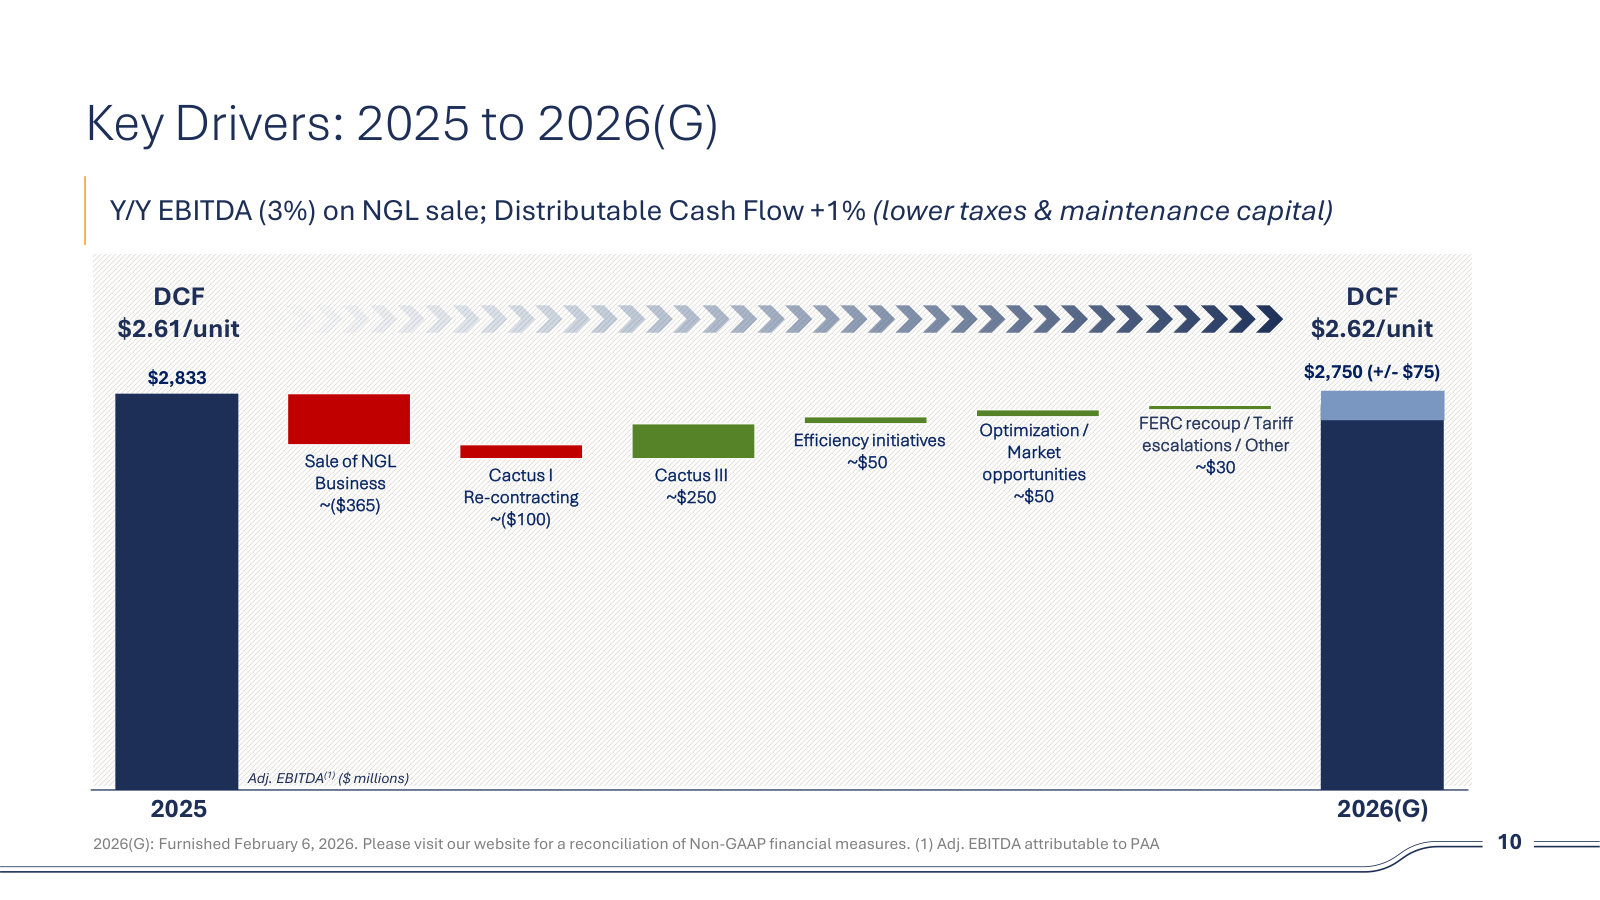
Al P. Swanson (Executive Vice President and CFO): Importantly, I would note that while headline EBITDA will decline slightly from the divestiture, distributable cash flow is expected to increase approximately 1% driven by lower corporate taxes and maintenance capital. As illustrated on Slide 11, we remain committed to generating significant free cash flow and returning capital to unitholders while maintaining financial flexibility. For 2026, we expect to generate approximately $1.8 billion of adjusted free cash flow, excluding changes in assets and liabilities, and excluding sales proceeds from the NGL divestiture.
p. 2 · Read in context →
The $50 million of Cactus III synergies broken into cost removal versus filling the pipe, with timing for each.
Jeremy L. Goebel (Executive Vice President): Manav, good morning. It is Jeremy. First, on the synergies question, the $50 million of synergies we disclosed, we believe we are already on run rate for that now. Roughly half of that was associated with G&A and OpEx reductions as well as removing things like insurance and other things that the pipeline had to maintain because it was a private equity-backed entity. Those are gone. So half the synergies were achieved in the fourth quarter as we shed those costs. The other 25% are associated with filling the pipeline with supply that we have, doing shorter-term deals just to fill that available capacity associated with quality management. Those were ramping up now. So we would imagine during the first quarter, we will be substantially there on the run rate for the $50 million, and we should hit that number this year.
p. 3 · Read in context →
Pressed on why coverage lands at 1.5x rather than 1.3x, management defends it as a deliberate reset, not a formula.
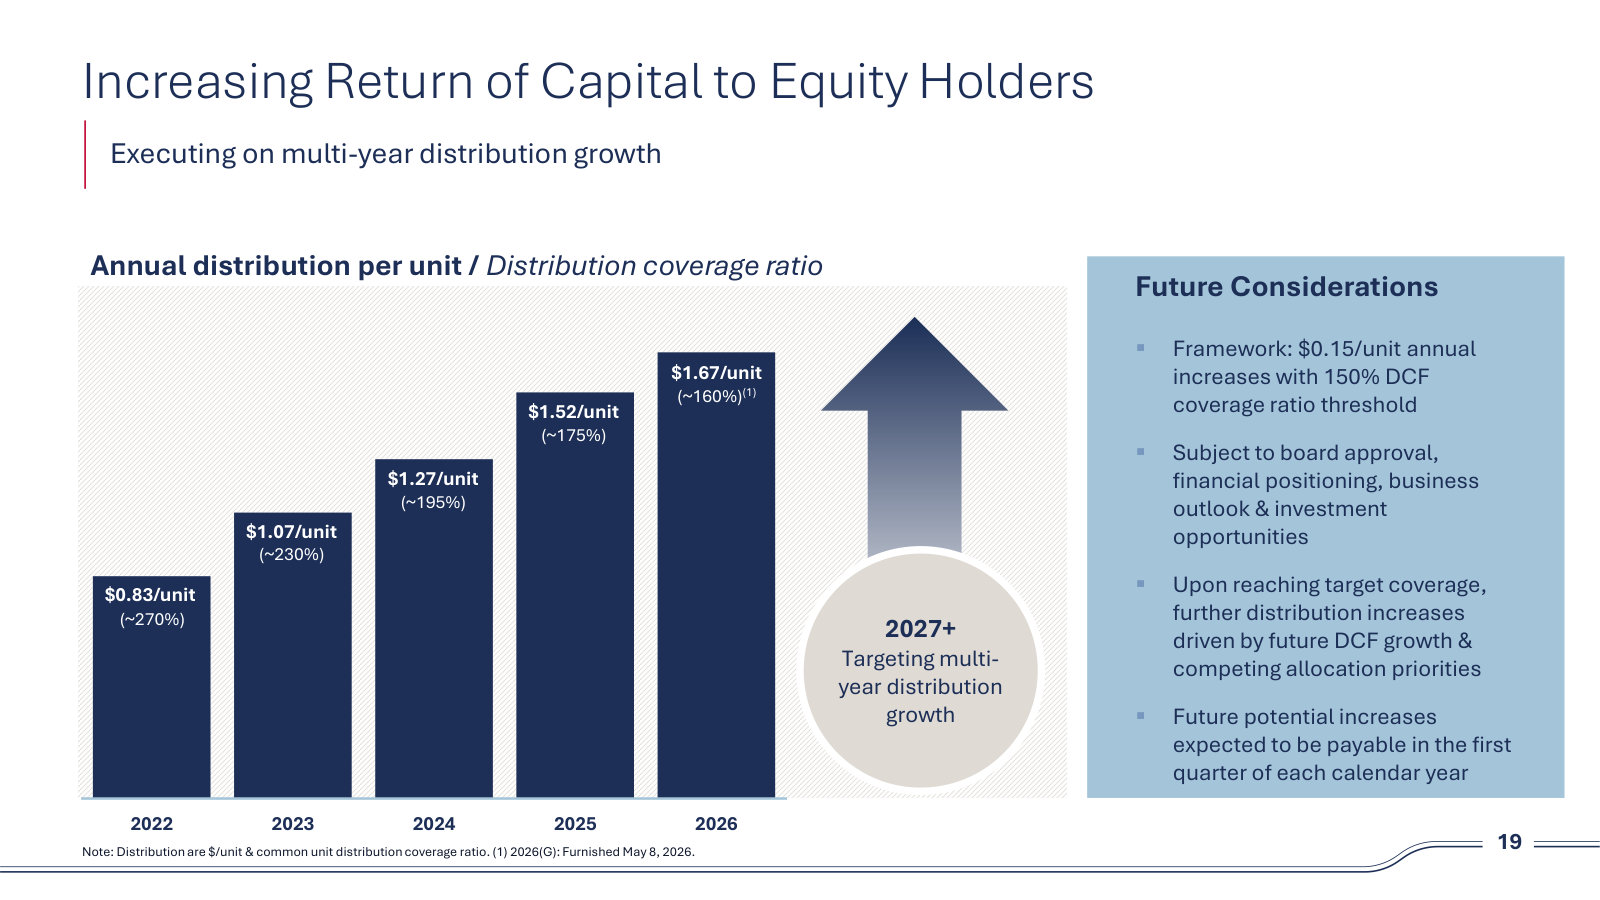
Michael Jacob Blum (Wells Fargo); Wilfred C.W. Chiang (Chairman and CEO): Maybe you could stay on the distribution coverage conversation. I am really just wanting to get a little more of your thought process on how you landed at 1.5 and not 1.4 or 1.3, just exactly there any kind of formulaic way we should be thinking about this? You know, you mentioned some of your peers, but, you know, I could take one peer off the top of my head that, you know, says 1.3 is the right coverage. So just trying to get a little more insight into your thinking on that. […] Willie, this is Willie, Michael. You know, when you think about how we came up with the one sixty, right, that was in November '22. And it was intended to be a coverage threshold that was conservative, reflecting in our focus on the balance sheet. I would not try to read too much into the delta. Other than at one fifty, it is still a conservative approach to distribution. And for us, it sets a nice balance for us as we look forward on the ability for multiyear distribution growth.
p. 5 · Read in context →
An analyst does the math on multiyear 15-cent raises; management confirms the growth that has to show up to fund them.
Keith Stanley (Wolfe Research); Wilfred C.W. Chiang (Chairman and CEO): I want to confirm, should we interpret that as the plan would be 15¢ increases for at least two more years? And if that is right, it implies a fair amount of growth. Since, you know, you would have to stay above that 150%. Can you just talk to some of the growth drivers you see in the next twenty-seven and twenty-eight that would support that? […] Yeah, Keith. This is Willie. You are very astute as you did your calculations. The message we wanted to send is we have the ability to continue to grow beyond 2026. If you think of our EBITDA this year, we have got a $100 million of NGL contribution. And if you think about '27 plus, we have got self-help that chews up easily half of that. Our comments earlier about additional growth in the Permian gives us confidence in that. And, we know we are going to be able to extract additional efficient growth synergies out of that. So out of our asset base. So we are telegraphing that we think we can grow beyond 2026.
p. 7 · Read in context →
A tour of the 40% of the business outside the Permian, asset by asset, and what each is expected to do.
Jeremy L. Goebel (Executive Vice President): Jeremy, good morning. What I would say is let us start from the North. Excited about Canada. As Chris mentioned, opportunities around our rainbow system to expand our rangeland system, more activity. The rest of the business is largely flat in Canada. So if you take our Rockies position, everything North of Cushing and West of Cushing, that is relatively stable and contracted, so flattish would be the view of that position. Cushing throughput continues at all-time highs year over year for us. So we think that those assets in Cushing and the refinery feed assets consistent with the refiners' performance should perform well this year. The South Texas is really somewhat of an extension of the Permian Basin business. It is a wellhead gathering business with trucking to support it. And so that step down from the Cactus contract did impact that business as well. As far as volumes and opportunity set following Ironwood, Cactus, three, and the integration with our legacy system, we are excited about what we see in South Texas. Now East of Cushing, the cap line system and Liberty in Mississippi, those are assets we are looking to fill longer-term and working on some longerterm contracting. And St. James continues to perform and with the expectation of growth in the Uinta Basin over the next eighteen months to continue to come through to our St. James facility. So think we have got exciting things across that platform. It is not as volatile, and it is not much growth on the other, but you will see some potential capital investment there as we get contracts to support it.
p. 10 · Read in context →
Q3 2025 Earnings Call — Q3 2025
The call where the NGL proceeds got redeployed: full ownership of EPIC Crude, its purchase economics, and the leverage bridge between the two deals (source capture carries stray web-page text around the transcript). · Open the full transcript →
What Plains paid for EPIC and what it expects back: mid-teens unlevered return, ~10x 2026 EBITDA, plus an expansion earn-out.
Al Swanson (Executive Vice President and CFO); Willie Chiang (Chairman, CEO and President): And on Monday this week, we signed and closed the acquisition of the remaining 45% operating interest in EPIC Crude Holdings from a portfolio company of Ares private equity funds for approximately $1.3 billion, inclusive of approximately $500 million of debt. As part of the 45% transaction, Plains has also agreed to a potential earn-out payment of up to $157 million tied to the sanctioning of potential expansions of the pipeline system by year-end 2028. […] The EPIC acquisitions are summarized on Slide four. These transactions are highly synergistic and very strategic to Plains' existing footprint and are expected to generate a mid-teens unlevered return. We anticipate a 2026 adjusted EBITDA multiple of approximately 10x, which we expect to improve meaningfully over the next few years. Going forward, we intend to rename the pipeline system Cactus III.
p. 6 · Read in context →
The NGL proceeds were spent before they arrived — and management flags the leverage overshoot that creates in between.
Willie Chiang (Chairman, CEO and President): Importantly, the majority of the proceeds to be received upon closing of the divestiture have effectively been redeployed through our acquisition of EPIC, which will result in an accretive and more durable cash flow stream. Due to timing differences between the closing of the transactions, we do anticipate our leverage ratio will temporarily exceed the upper end of our target range until the NGL divestiture is finalized, at which point we expect our leverage ratio to trend towards the midpoint of our target range of 3.5.
p. 7 · Read in context →
Why owning the operating interest, not just an economic stake, is what makes the synergy case credible.
Michael Blum (Wells Fargo); Willie Chiang (Chairman, CEO and President): Wanted to ask on the EPIC deal. Can you give us a little more detail on the synergy capture? How much of that is going to be cost savings versus commercial synergies? And where do you see the timeline? Will you capture those synergies and then reach that mid-teens return? […] Michael, good morning. This is Willie. First thing I want to do is I want to compliment our team. If you think about these transactions, these are never perfect timing, and they're hard to do. And we were able to do the two portions, and particularly with the 45% just announced. It gives us the ability to have more control over every question that you asked. I would also refer you to slide four. If you look at the map and you see how integrated it is with the system, I think that helps illustrate the number of ways that we can win. There are a lot of ways we can do this. There's a lot of cost structure savings.
p. 9 · Read in context →
EPIC was bought at market tariffs, not above them — the reason management calls the NGL-for-crude swap accretive over time.
Jeremy Goebel (Executive Vice President): Sure, Keith. This is Jeremy. There's a substantial portion of the pipeline that's contracted for long term, and I believe that was announced in the restructuring last year that EPIC did. The balance of the pipe has medium duration contracts. We feel comfortable in our ability to work with those shippers to either extend those contracts or add new shippers to those contracts. We're just taking over this week, so it'd be premature to talk about everything associated with it. But I'd say we like where we sit. […] Like, the rates are at current market rates, that they're not meaningfully above market rates, which means longer term, we expect to be a stable and growing cash flow profile, which at least to Michael's question earlier about DCF accretion between the sale of the NGL and this business. We think that will be substantially DCF accretive over time the trade of those two assets.
p. 12 · Read in context →
Q2 2025 Earnings Call — Q2 2025
The pivot call: the $3.75 billion NGL sale to Keyera, what management intends to do with the proceeds, and the return test every deal has to clear. · Open the full transcript →
The Keyera sale announced: price, timing, and the case that a narrower portfolio is a better one.
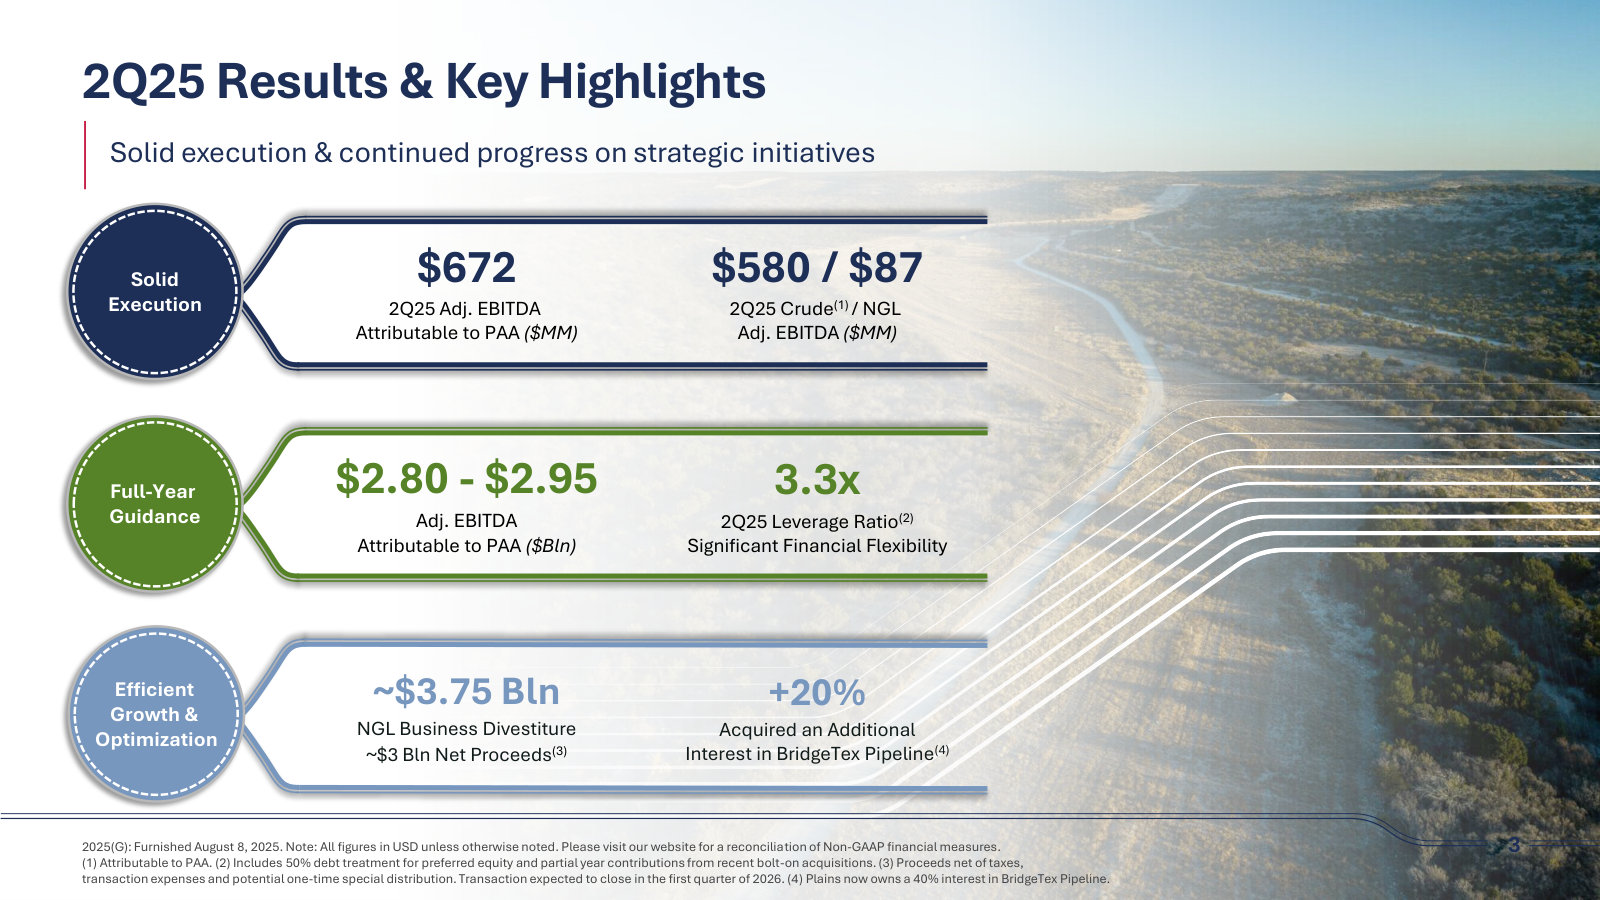
Wilfred C.W. Chiang (Chairman, CEO and President): In June, we announced the execution of definitive agreements to sell substantially all of our NGL business to Keyera for approximately USD 3.75 billion with an expected close in the first quarter of 2026. Initial investor feedback has been positive, and we view this as a win-win transaction for both parties. […] From a Plains perspective and as highlighted on Slide 4, this transaction will result in a streamlined crude oil midstream entity, with less commodity exposure, a more durable and steady cash flow stream and substantial financial flexibility to further execute on our capital allocation framework. With approximately $3 billion of net proceeds from the sale, we expect to continue focusing on disciplined bolt-on M&A to extend and expand our crude oil-focused portfolio as well as opportunities to optimize our capital structure, including potential repurchases of Series A and B preferred units along with opportunistic common unit repurchases.
p. 1 · Read in context →
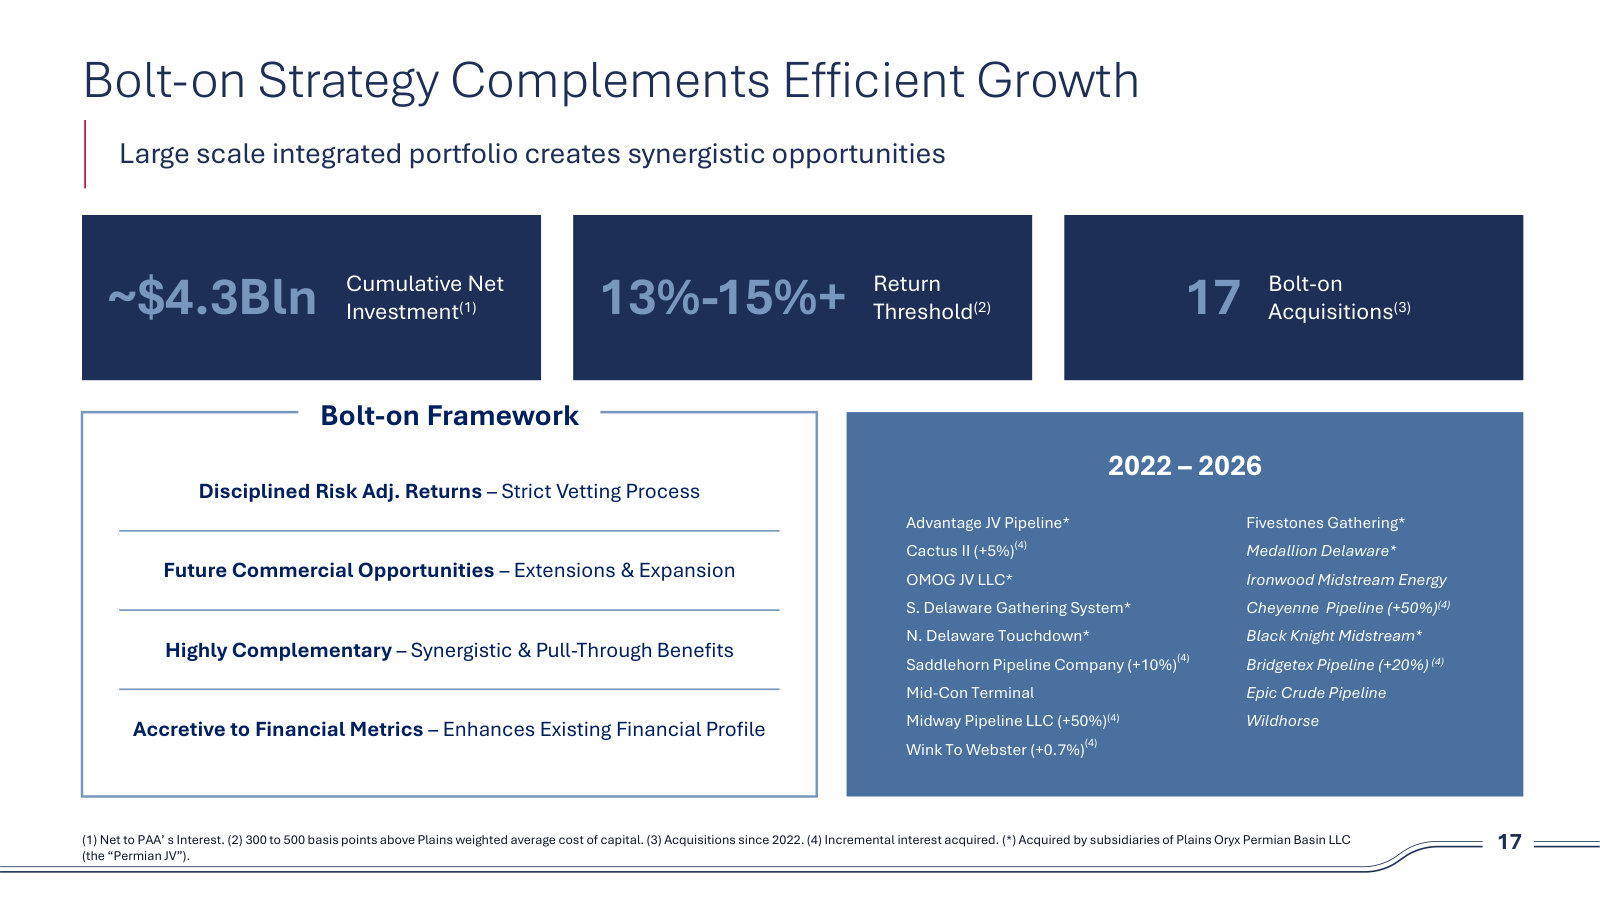
How acquisitions are underwritten: discounted cash flow across the integrated network, cleared against cost of capital plus 300-500 bps.
Jeremy L. Goebel (Chief Commercial Officer): Shneur, this is Jeremy. Here's what I would say: we take all that into consideration. And candidly, as we've said before, we're a DCF shop, and we're looking for discounted cash flow over time and contributions. You have to look at the integrated network. So take the Mid Continent, for instance, with your example, we have a lot of assets that touch a lot of other areas. So things that could impact Cushing or other downstream pipelines may have multiple touch points. So while the Permian has different resources. We look at them independently and use market fundamentals to drive an outlook of cash flows, and we use a discounted cash flow, and we have to beat our return thresholds. Our cost of capital by 300 to 500 basis points as we've said. So we take all that into consideration. We're not necessarily going to say where our target area is right now, but we do look at everything, and we've got to hit our return thresholds, and we certainly take a look at fundamentals and multiple touch points have in each area.
p. 3 · Read in context →
Why second-half 2025 looked flat: long-haul contracts rolled to lower market rates and growth had to backfill them.
Jeremy L. Goebel (Chief Commercial Officer): Spiro, it's Jeremy. Just remember, we have the contract roll-offs of Cactus II and Cactus I and Sunrise in the second half of the year, all consistent with guidance. So those roll of of the contract rates, all those volumes have been re-contracted. It's a function of rates being lower. So you had those contributions in the first half, you're going to have the growing production the FERC escalator and other pieces contributing to backfill that. So while it may look flat, you backfilled some of the roll-off of the contracts with growth.
p. 5 · Read in context →
Q1 2025 Earnings Call — Q1 2025
The thesis under stress: tariffs and OPEC supply hit mid-quarter, and management spells out the price levels, hedges and balance-sheet room that absorb it. · Open the full transcript →
The tariff-and-OPEC shock as management framed it in real time, with the guidance consequence stated plainly.
Willie Chiang (Chairman and CEO): The ongoing uncertainty on trade tariffs is weighing on economic forecasts and creating significant volatility. Additionally, the dissension among OPEC members and the prospects of incremental supply coming to market have resulted in a lower price commodity than anticipated at the beginning of the year. Nevertheless, we believe a lower price environment will ultimately reinforce the cyclical nature of the commodity markets, leading to a constructive medium to long-term outlook. […] Assuming a $60 to $65 WTI environment persists for the remainder of the year, we would expect both our 2025 EBITDA guidance and Permian growth outlook could be in the lower half of the respective ranges. Our NGL segment remains largely insulated from lower commodity prices, with approximately 80% of our estimated C3+ spec products sales hedged for 2025. In this environment, we believe it's more important than ever to remain focused on what we can control.
p. 1 · Read in context →
The price bands that actually move Permian drilling: below $55 flat to declining, above $65 back to growth.
Jeremy Goebel (Chief Commercial Officer): Sure, Michael. I'll take the 25. But what I can tell you is you've already grown over a hundred thousand barrels a day from the end of last year to now. So the 200,000 barrels a day does not seem very herculean as a growth expectation. I would say, by and large, the producers are in a very similar situation. It's a bit of a wait and see. The volatility just started a month ago. And so you don't make two or three-year plans based on one month of activity and you've seen some rebound in it. So I think in the next three months, it's a function of time and it's a function of flat price. So it's a short period of time at this price. If it sustains for a longer period of time here, you will see some flattening out. […] If it goes below $55 per barrel, you've heard from the producer community. They would start to go flat and maybe even decline. If it gets above $65 for an extended period of time, you'll see it go the other way. You'll see it back to growth. So from our standpoint, there's a bit of a wait and see at this point.
p. 4 · Read in context →
Bolt-ons are priced to a return threshold, not a headline multiple — synergies are what compress the multiple afterward.
Chris Chandler (Plains management): Let me go ahead and take that. So as opposed to multiples, both hit our return thresholds where they should. That's it. Willie mentioned capital discipline. The first was a reductio in future MVCs in exchange for taking ownership of the asset from a partner. We priced in our rates of return there, and we've done as well or better filling the pipeline after the fact. The gathering transaction, once again, our goal is to earn our base return with limited synergy allocation and then compress that multiple with synergies. So I'd say both of them fit the model of the previous 12 acquisitions.
p. 5 · Read in context →
How the leverage range is meant to be used — capacity for deals, bounded by the mid-BBB ratings.
John Mackie (Goldman Sachs); Willie Chiang (Chairman and CEO); Al Swanson (Executive Vice President CFO): You know, John, I'll start now and certainly add. But we've been very clear about our capital allocation plan. One, we're committed to returning cash to the unitholders. And we've got our targeted increase to a coverage limit that we've announced years ago. And we're going to execute on that. We are also very optimistic and continue to work on the bolt-ons. And we think that opportunity set is out there, and that is really the primary focus on the highest return options for cash. So those two are going to drive it. Our leverage is at the lower end. If there were some transactions that made sense, we've always said that we would allow the leverage to go up with the understanding that, in the planning, it doesn't stay up. So we're using that leverage range really to our benefit as we think about what we might be able to do as far as growing in a capital disciplined way. Al, anything to add? […] Yeah. The only thing I would add is it is a range, the leverage range. We don't have the stated desire to be at the bottom end or below on a sustained basis. So we do look at the ability to use some of that capacity for strategic quality investments as we look ahead. We just recently in the last year got triple B rated at all three agencies. We do not view and have no interest in putting leverage at a point that would jeopardize any of those ratings.
p. 8 · Read in context →
Q4 2024 Earnings Call — Q4 2024
The pre-transformation baseline, and the best single explanation of how the crude business earns: long-haul recontracting, scarcity of new pipe, PLA exposure and the distribution formula. · Open the full transcript →
The CEO retires his own flat-EBITDA-through-2026 guidance and explains what that guardrail was ever for.
Michael Blum (Wells Fargo); Willie Chiang (Chairman and CEO): Hey, good morning, everyone. So I wanted to ask, you previously guided flat EBITDA from 2024 to 2026. You said growth projects will offset Cactus recontracting. Here, you're up a little bit in 2025. So I just wanted to get a sense of do you now expect EBITDA is going to increase gradually from here on out? Or are there other puts and takes we should be considering over the next couple of years? […] Michael, thanks for the question. I want to move away from the flat guidance we provided for 2024 to 2026. To give some context, back then, we had long-term contracts expiring that were quite favorable and reverting to market rates as anticipated. The purpose of that guidance was to provide a snapshot of the business at that time and reassure everyone that we were not facing a significant drop-off. As we grow our business, we expect that by 2026, our performance will surpass that of 2024.
p. 5 · Read in context →
The distribution framework since November 2022, why raises have run ahead of the 15-cent baseline, and why that buffer shrinks.
Willie Chiang (Chairman and CEO): Conceptually, the answer is yes. Obviously, if you think about our business, we've got the base business growth and then we've got bolt-on. So we factor all of that as we go forward. And I mean, we've been very pleased to be able to return more back to the unitholders. In November of 2022, we came out with this framework targeting the $0.15, and we've been able to do $0.20 increases in 2023 and 2024 and now the $0.25 increase in 2025. So I think the framework works, and when we do better, more money goes back to the unitholders. But there's a lot of moving parts, but generally speaking, you're absolutely right. We have a little bit of coverage buffer over this period of time to allow us to continue to grow, even if the bolt-ons and growth may not have been there. But as we go forward and shrink some of that buffer, it's going to be more dependent upon our base business and the timeliness of some of those bolt-ons.
p. 9 · Read in context →
Why there is no grand recontracting event — uncontracted long-haul space is monetized quarter by quarter instead.
Jeremy Goebel (Chief Commercial Officer): I think it's just going to be gradual overtime. This is also part of the continuous improvement mindset that Willie outlined. This is something we don't have to rush on. Current differentials wouldn't support it. So we would sign shorter-term contracts. So we'll let you know if there's to talk about, otherwise, we'll continue to optimize the space. And just because it's not contracted, it doesn't mean we're not filling in or finding ways to do shorter-term deals and generate revenue from it. So I look at it as we are absolutely trying to generate as much margin and revenue as we can. And we'll optimize the value of that space. But I wouldn't expect any grand unveil of re-contracting for that asset.
p. 12 · Read in context →
Capacity versus economic capacity: why a new Gulf Coast long-haul line is hard to build, and what that scarcity is worth.
Willie Chiang (Chairman and CEO): And John, this is Willie. The way I think about it from a macro standpoint. You've got the capacity and you've got economic capacity. It's going to be hard to build a new long-haul pipeline to the Gulf Coast. If you think about commercial commitments it takes, the permitting/supply chain issues. So I think our view is, you have to balance what you think ultimately Permian growth is going to be. So my guess is we're going to get to this point where it is going to get tighter capacity. And we're probably going to live in that space for a while. And whether or not a new long-haul line gets built, it's really going to be dependent upon kind of a broader view of, can the Permian go the next step. So I think we're going to be in pretty good place in the next number of years. We certainly have struggled in the overcapacity years in the past number of years.
p. 12 · Read in context →
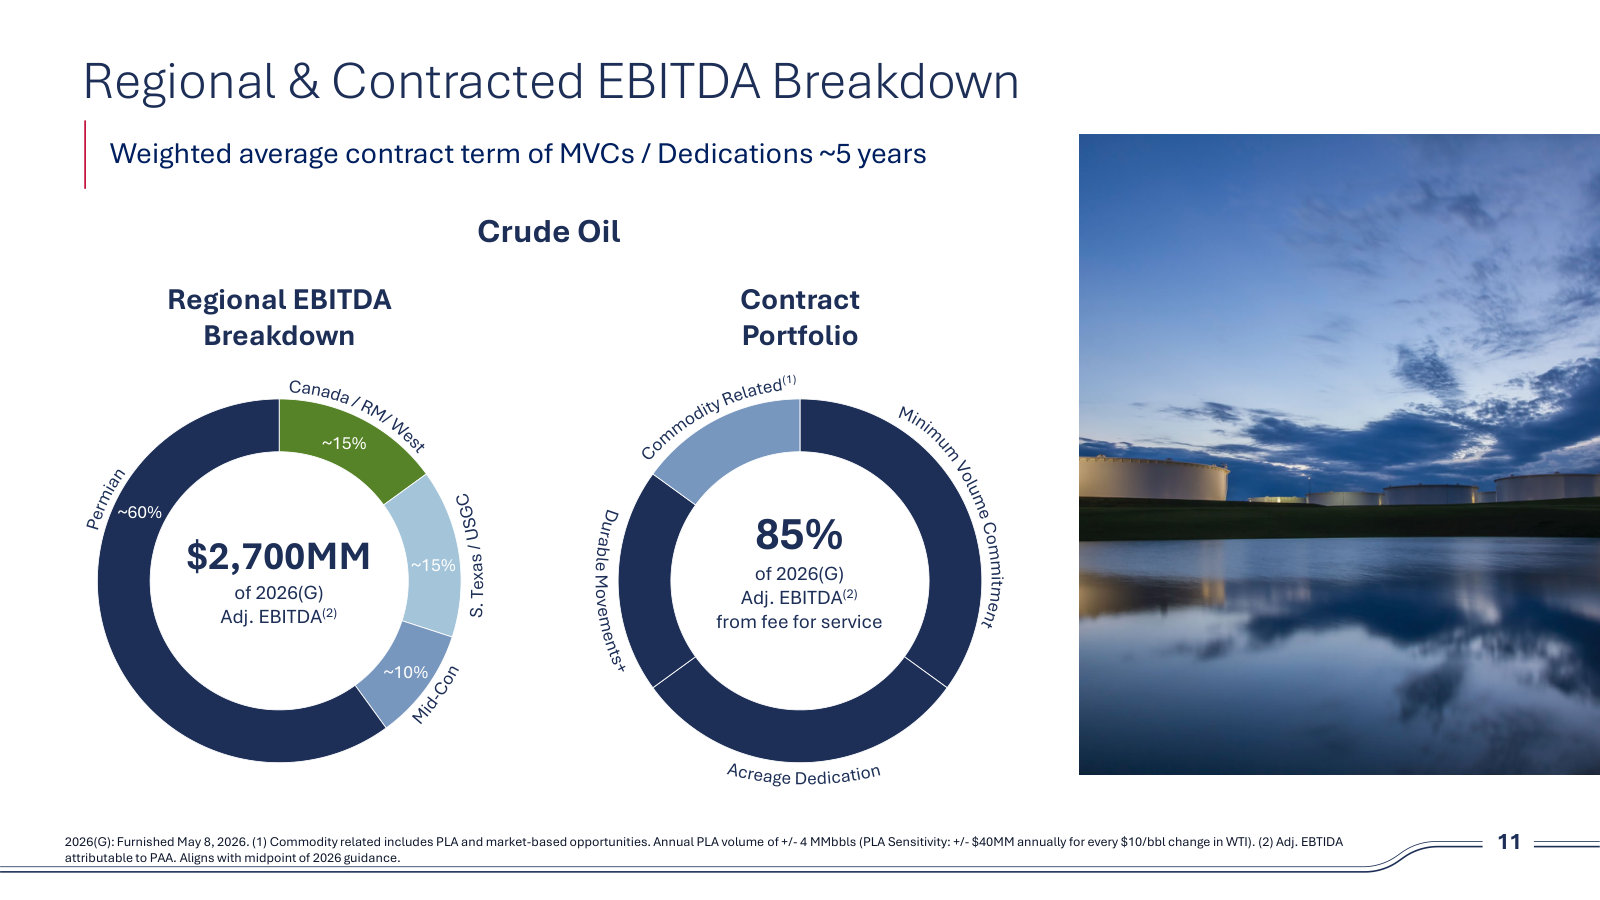
The commodity-price exposure quantified: roughly 4 million PLA barrels a year, so a $10 move is about $40 million of EBITDA.
Theresa Chen (Barclays); Blake Fernandez (Vice President of Investor Relations): Would you mind reminding us what your PLA volumetric exposure is at this point, just as we try to frame up the sensitivity to the $75 to EBITDA assumption within your 2025 guidance? […] Hey Teresa, it's Blake. The last update we've given is four million barrels a year. So cal it, a $10 move equates to roughly $40 million of EBITDA.
p. 13 · Read in context →
More calls
Q3 2024 Earnings Call — Q3 2024 · 8 pages · Where the 2015 Line 901 spill liability was finally settled and Moody’s completed the mid-BBB ratings set at all three agencies. · Open →
Q2 2024 Earnings Call — Q2 2024 · 12 pages · The clearest tally of the bolt-on programme itself — eight deals for roughly $535 million since mid-2022 — and how joint-venture stakes generate that opportunity set. · Open →
Q1 2024 Earnings Call — Q1 2024 · 9 pages · The Permian long-haul recontracting was settled here with real numbers: about five years weighted-average duration through 2028 and 200,000 b/d of Cactus I at $1.25–$1.50 per barrel. · Open →
Q4 2023 Earnings Call — Q4 2023 · 24 pages · Go here for the 2023 scorecard that funded the pivot to offence — 3.1x leverage, two ratings upgrades and the first $0.20 distribution step-up. · Open →
Q3 2023 Earnings Call — Q3 2023 · 22 pages · The call that lowered the long-term leverage target to 3.25–3.75x and pulled the annual distribution increase forward from May to February. · Open →
Q2 2022 Earnings Call — Q2 2022 · 31 pages · The upcycle counterpoint: repeated guidance raises, and management explaining why it would not term up Corpus contracts while spot economics were strong. · Open →
Q4 2021 Earnings Call — Q4 2021 · 39 pages · The deleveraging-era Plains — $1.65 billion of free cash flow, $1 billion of debt repaid, asset sales and a Moody’s return to investment grade — the base the current framework was built on. · Open →
Q2 2021 Earnings Call — Q2 2021 · 29 pages · Where the Plains Oryx Permian joint venture was announced, the transaction that shaped today’s gathering footprint and its dedicated-acreage economics. · Open →
Plains GP Holdings, L.P.'s annual reports contain management's most considered account of the business. These are the sections, passages and visual pages worth opening in the originals preserved in Sources.
Plains GP Holdings, L.P. — FY2025 Annual Report (Form 10-K) — FY2025
The first 10-K written as a crude-oil pure play: the Canadian NGL business is held for sale and restated into discontinued operations. · Open the full document →
Items 1 and 2. Business and Properties — General — p. 8 · Read the full section →
States the two facts that define PAGP: it owns no operating assets, and it is selling substantially all of its NGL business.
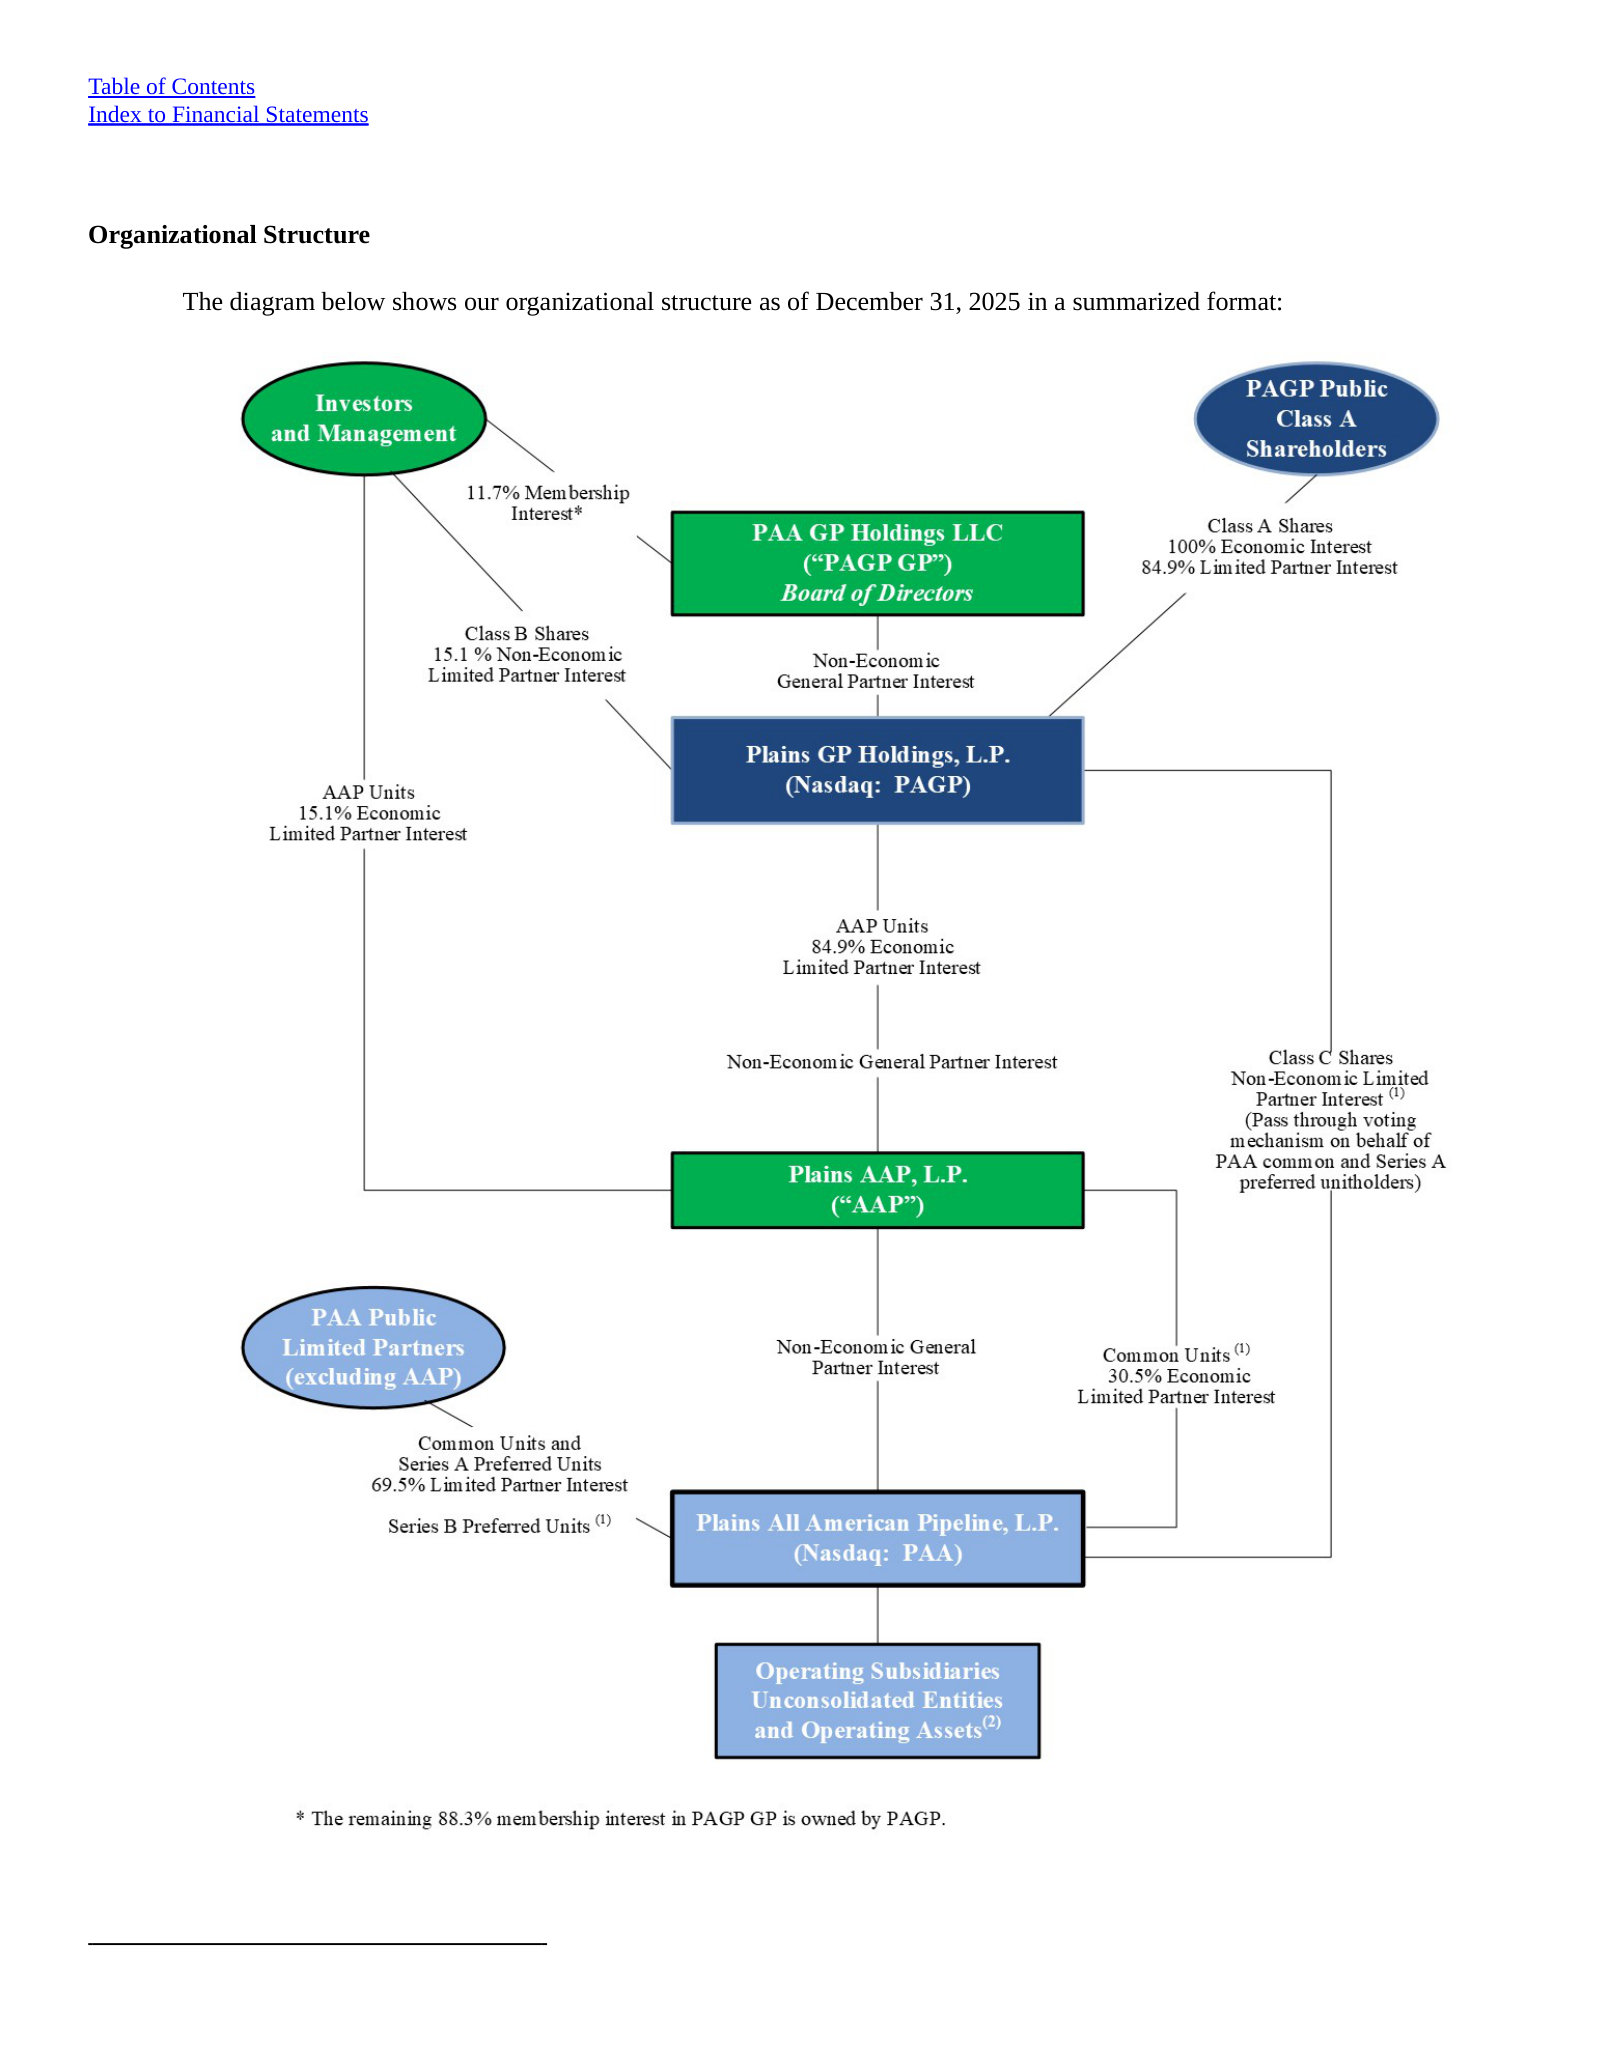
Our Business Strategy — p. 11 · Read the full section →
Explains Economic Parity — why one Class A share tracks one PAA common unit — and PAA's stated shift to a crude-only business.
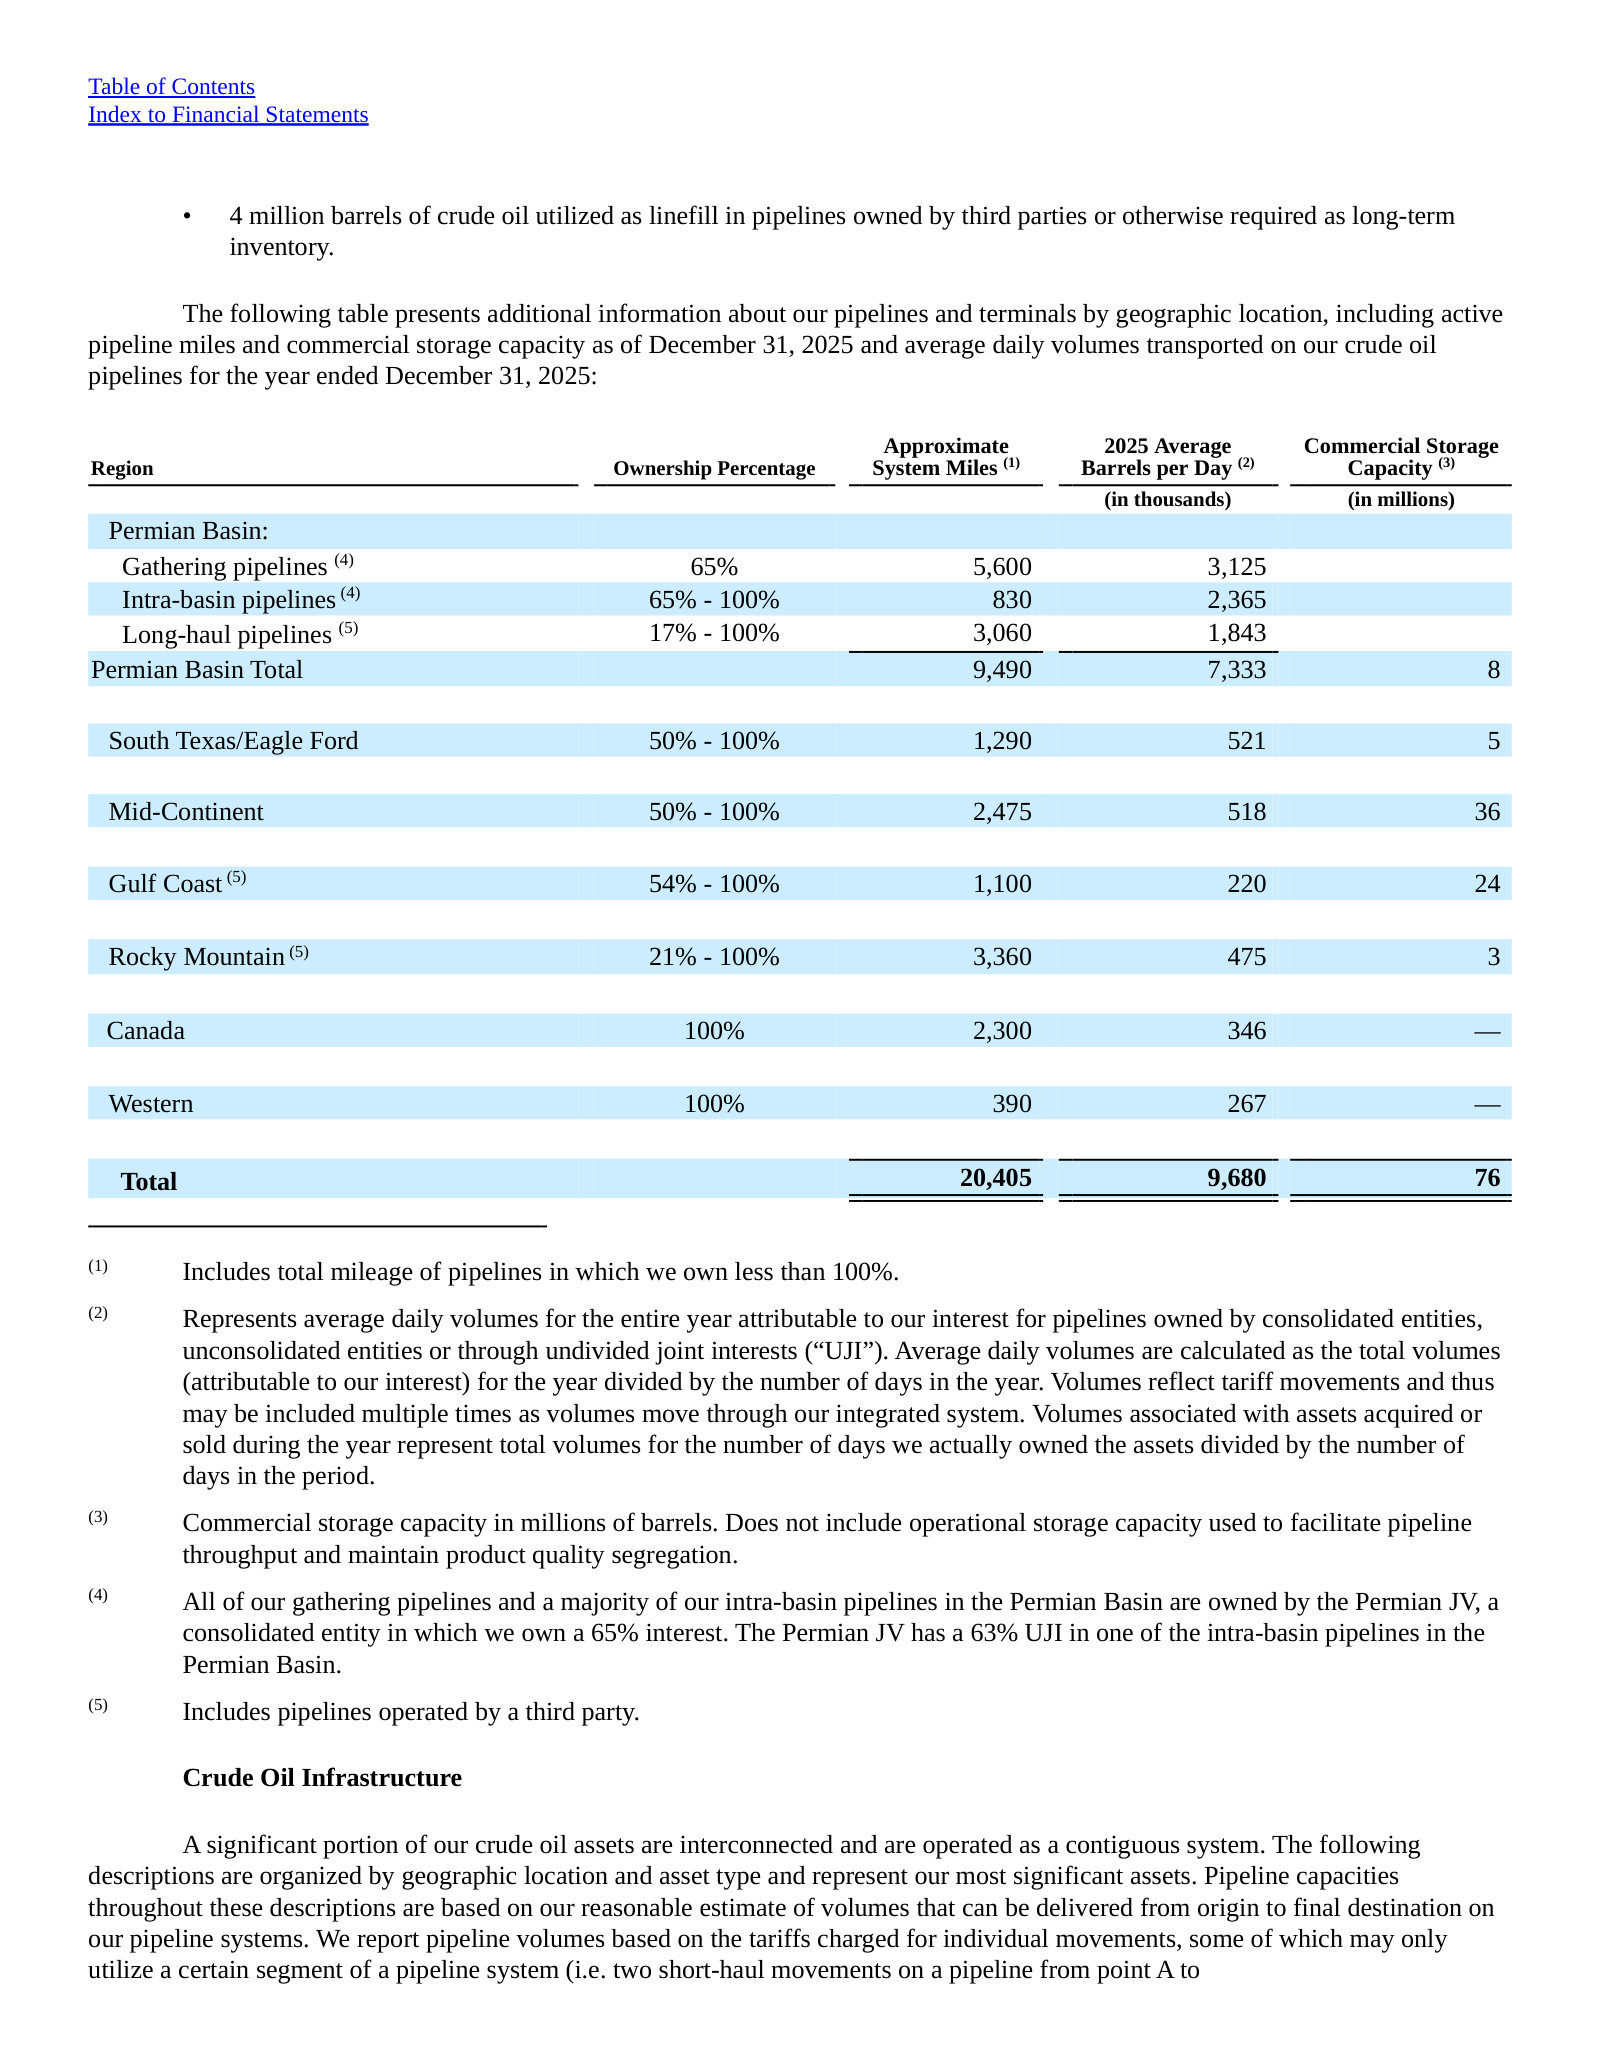
Crude Oil Segment — p. 15 · Read the full section →
The segment that is now essentially all of continuing operations; sets out which dollars are tariffs and which are merchant margin.
How the crude segment earns: tariffs and capacity agreements, storage and terminalling fees, plus merchant activity.
Our Crude Oil segment operations generally consist of gathering and transporting crude oil using pipelines (including gathering systems), trucks and, at times, on barges or railcars, in addition to providing terminalling, storage and other related services utilizing our integrated assets across the United States and Canada. Our assets provide services to third parties as well as to our merchant activities. Our merchant activities include the purchase of crude oil supply and the movement of this supply on our assets or third-party assets to sales locations, including our terminals, third-party connecting carriers, regional hubs or to refineries. […] With respect to the transportation assets in this segment, we primarily generate revenue through a combination of tariffs, pipeline capacity agreements and other transportation fees. With respect to our crude oil terminal and condensate processing assets in this segment, we primarily generate revenue through a combination of month-to-month and multi-year agreements and arrangements which include storage, throughput and loading/unloading fees at our crude oil terminals and processing facilities. We also generate significant revenue through a variety of commercial and merchant activities that often result in increased utilization of our transportation and storage assets.
p. 17 · Read in context →
NGL Segment — p. 29 · Read the full section →
The last full description of the Canadian NGL business before it leaves — extraction rights, replacement gas, hedged merchant margin.
What remains in the NGL segment versus the Canadian merchant model being sold.
Our NGL segment operations involve NGL storage and terminalling from our NGL assets located primarily in the Southwestern United States. Our NGL segment revenues are primarily derived from (i) providing storage and/or terminalling services at these facilities to third-party customers for a fee and (ii) the transport, storage and sale of specification NGL products. […] Our Canadian NGL Business merchant activities include the acquisition of extraction rights from producers and/or shippers of the gas streams that pass through our Empress facility. The extraction rights allow us to process that gas at our Empress facility and extract the higher valued NGL from the gas stream. We then purchase natural gas to replace the thermal content attributable to the NGL that was extracted. We use our assets to transport, store and fractionate NGL mix extracted from our Empress straddle plants, or NGL mix acquired from third parties, into finished products to sell to customers. We may also acquire finished NGL products to be seasonally stored in our storage caverns, which is then resold to third-party customers. Often times we will use derivative instruments to hedge the margins related to these merchant activities.
p. 29 · Read in context →
Impact of Commodity Price Volatility and Dynamic Market Conditions on Our Business Model — p. 33 · Read the full section →
Management's own account of what commodity prices do and do not do to cash flow — the crux of the midstream model.
Absolute price levels are not the exposure; compressed regional differentials are.
While our objective is to position the Partnership such that our overall annual cash flow is not materially adversely affected by the absolute level of energy prices, market volatility associated with shifts between demand-driven markets and supply-driven markets or other similar dynamics may create market conditions that are more challenging to our business model. In extended periods of lower crude oil and/or NGL prices, or periods where the supply and demand fundamentals compress regional location differentials, our financial results may be adversely impacted. Under such market conditions, product flows on our pipelines or through our facilities may be adversely impacted. Alternatively, in periods where supply exceeds regional demand and/or pipeline egress, product flows on our pipelines or through our facilities may be favorably impacted. […] In addition, relative contribution levels will vary from quarter-to-quarter due to seasonality, particularly with respect to our NGL merchant activities.
p. 35 · Read in context →
Item 1A. Risk Factors — Risks Inherent in an Investment in Us — p. 67 · Read the full section →
PAGP's distribution is a pass-through of PAA's, and a $1.2 billion deferred tax asset sits behind reported book equity.
If PAA cuts its per-unit distribution, PAGP would likely cut its own.
The source of our earnings and cash flow currently consists exclusively of cash distributions from AAP, which currently consist exclusively of cash distributions from PAA. […] PAA may not have sufficient available cash each quarter to continue paying distributions at its current level or at all. If PAA reduces its per unit distribution, either because of reduced operating cash flow, higher expenses, capital requirements or otherwise, we will have less cash available for distribution and would likely be required to reduce our per share distribution.
p. 67 · Read in context →
A valuation allowance on the $1.2 billion gross deferred tax asset would hit earnings and capital immediately.
As of December 31, 2025, we had a gross deferred tax asset of approximately $1.2 billion. Generally accepted accounting principles in the United States (“GAAP”) requires that a valuation allowance must be established for deferred tax assets when it is more likely than not that they will not be realized. We believe that the deferred tax asset we recorded through 2025 will be realized and that a valuation allowance is not required. However, if we were to determine that a valuation allowance was appropriate for our deferred tax asset, we would be required to take an immediate charge to earnings with a corresponding reduction of partners’ capital and increase in balance sheet leverage as measured by debt-to-total capitalization.
p. 73 · Read in context →
Risk Factors — Risks Related to PAA's Business — p. 77 · Read the full section →
Names the operating risk already visible in results: overbuilt midstream capacity and Permian long-haul contracts resetting lower.
Recontracting risk on long-haul Permian pipelines amid excess midstream capacity.
These competitive risks make it more difficult for PAA to attract new customers and expose PAA to increased contract renewal and customer retention risk with respect to its existing customers and make recontracting at favorable rates and volumes more challenging, including, for example, with respect to certain of PAA’s long-haul Permian pipelines. […] A significant driver of competition in some of the markets where PAA operates (including, for example, the Eagle Ford, Permian Basin, and Rockies/Bakken areas) stems from the rapid development of new midstream energy infrastructure capacity that was driven by the combination of (i) significant increases in oil and gas production and development in the applicable production areas, both actual and anticipated, (ii) relatively low barriers to entry and (iii) generally widespread access to relatively low cost capital. While this environment presented opportunities for PAA, many of the areas where PAA operates have become overbuilt, resulting in an excess of midstream energy infrastructure capacity.
p. 79 · Read in context →
Item 7. Management's Discussion and Analysis — Executive Summary — p. 114 · Read the full section →
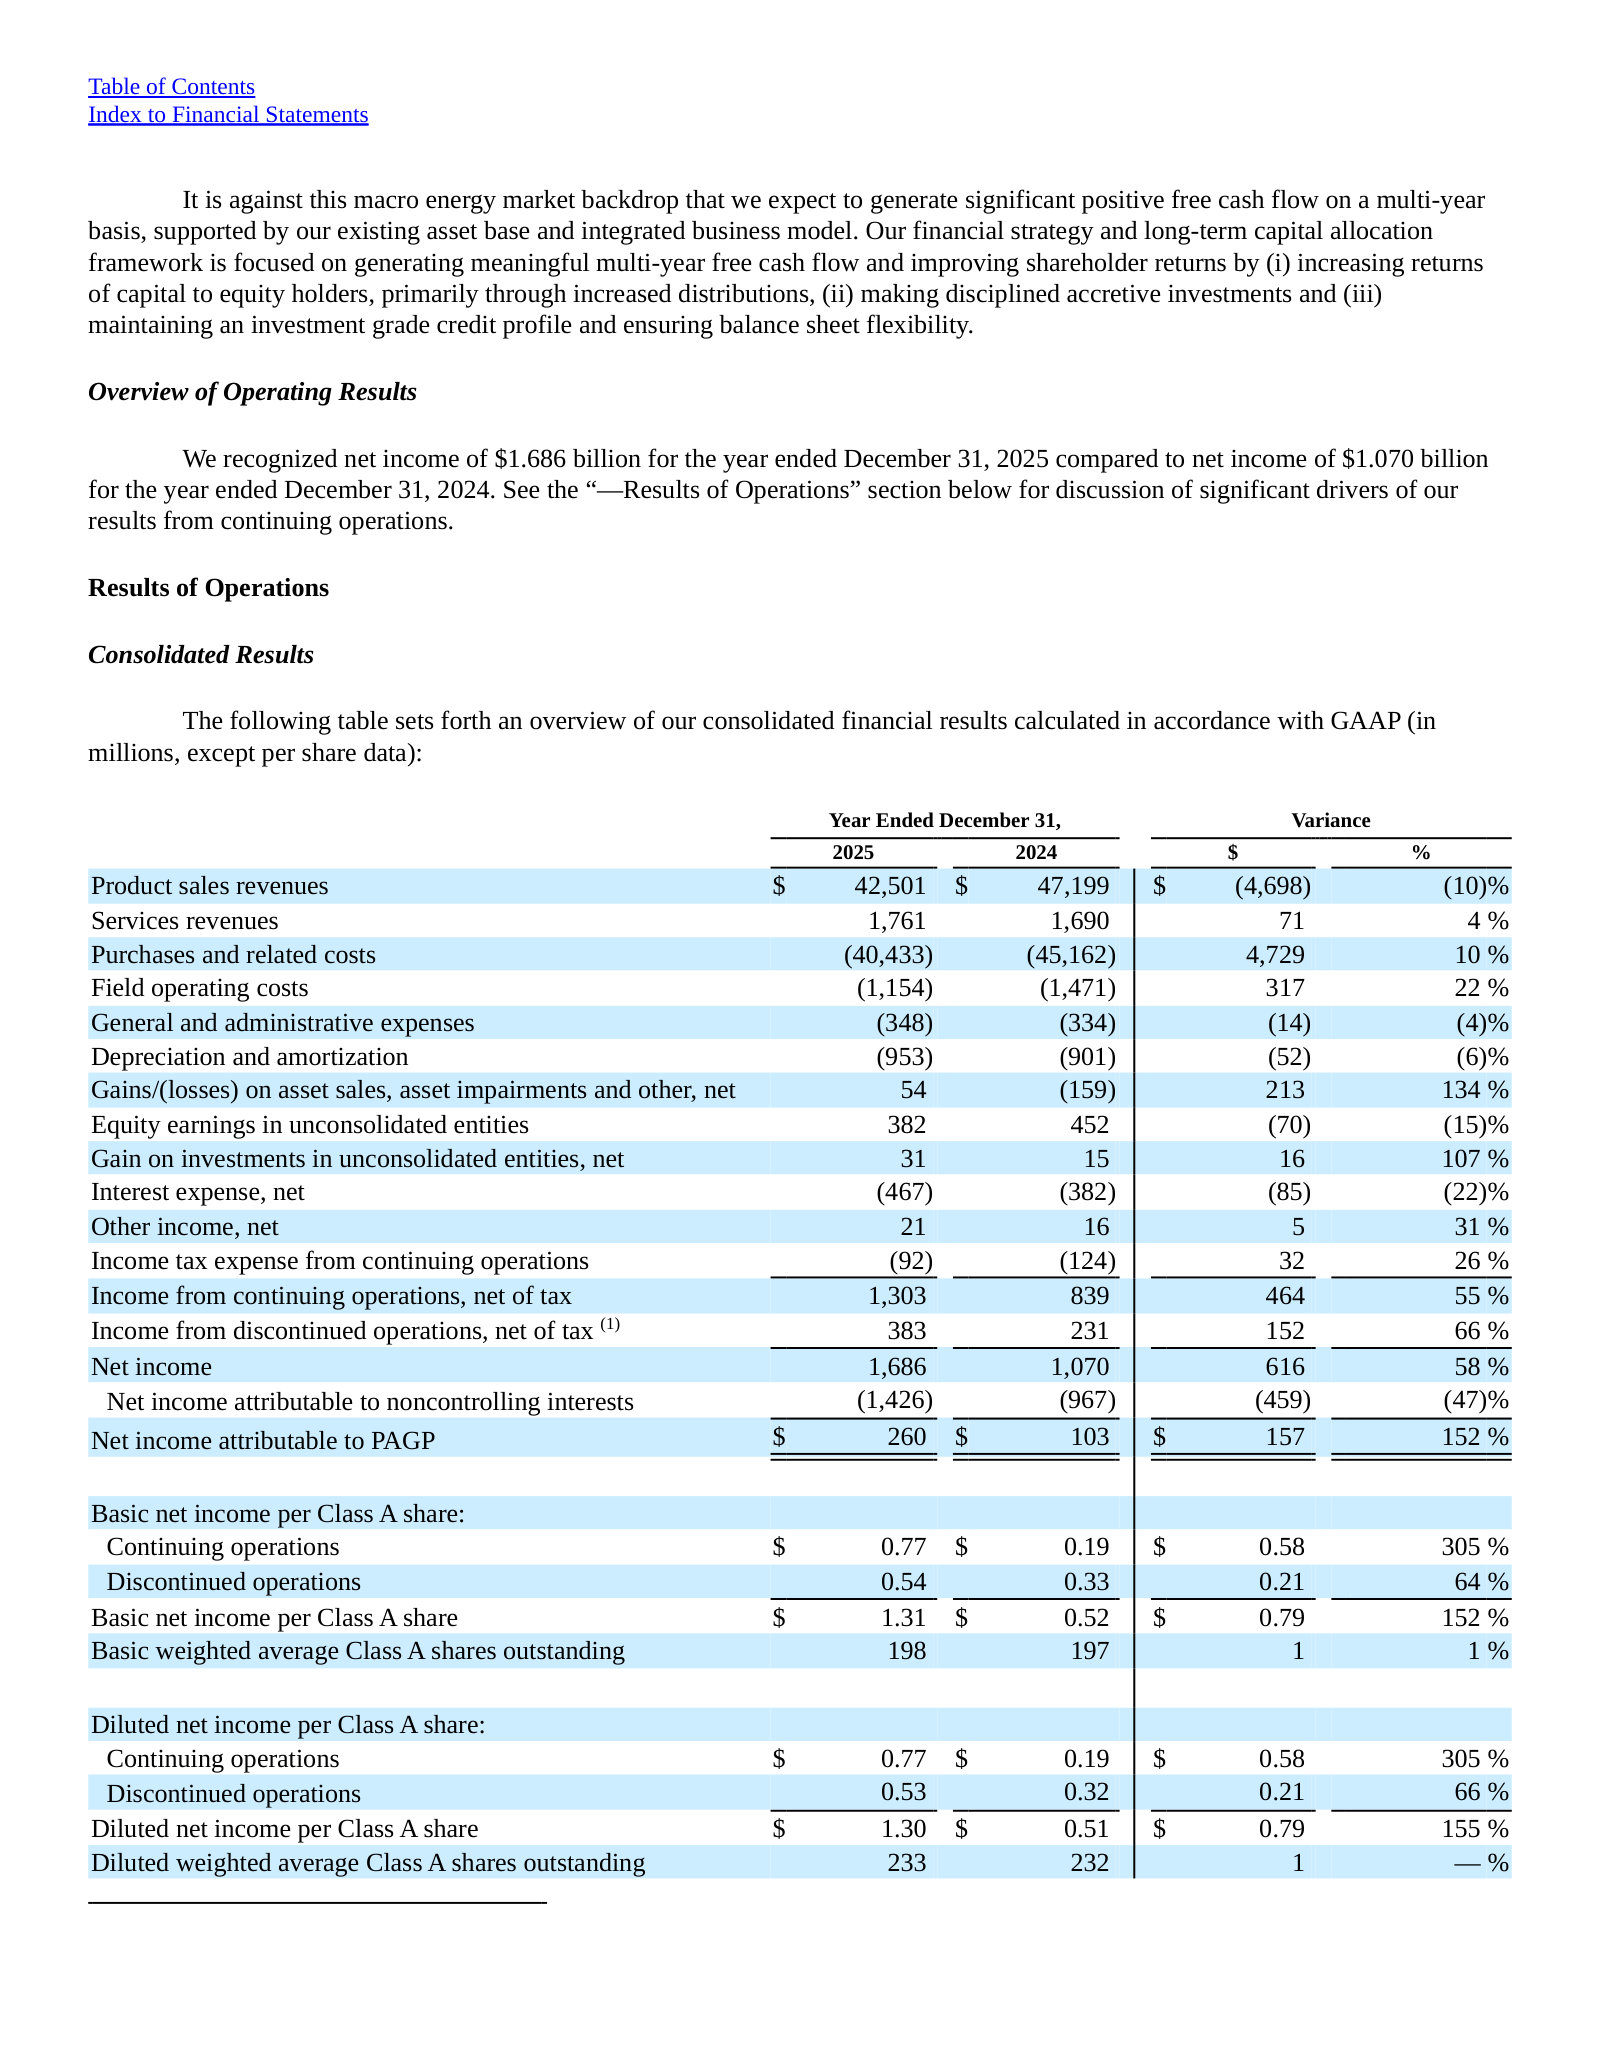
Management's rationale for the divestiture, and the consolidated table showing how little of net income reaches PAGP.
Why the Canadian NGL sale was done, and why prior periods were restated.
This transaction supports our strategic objective to focus on our core midstream crude oil operations and to reduce exposure to commodity price fluctuations and seasonality. […] We determined that in conjunction with entering into the SPA, the operations of the Canadian NGL Business meet the criteria for classification as held for sale and for discontinued operations reporting, as the sale will represent a strategic shift that will have a major effect on our operations and financial results.
p. 114 · Read in context →
Analysis of Operating Segments — p. 125 · Read the full section →
The segment tables and the paragraph where management attributes the year's EBITDA change to specific volume, tariff and contract effects.
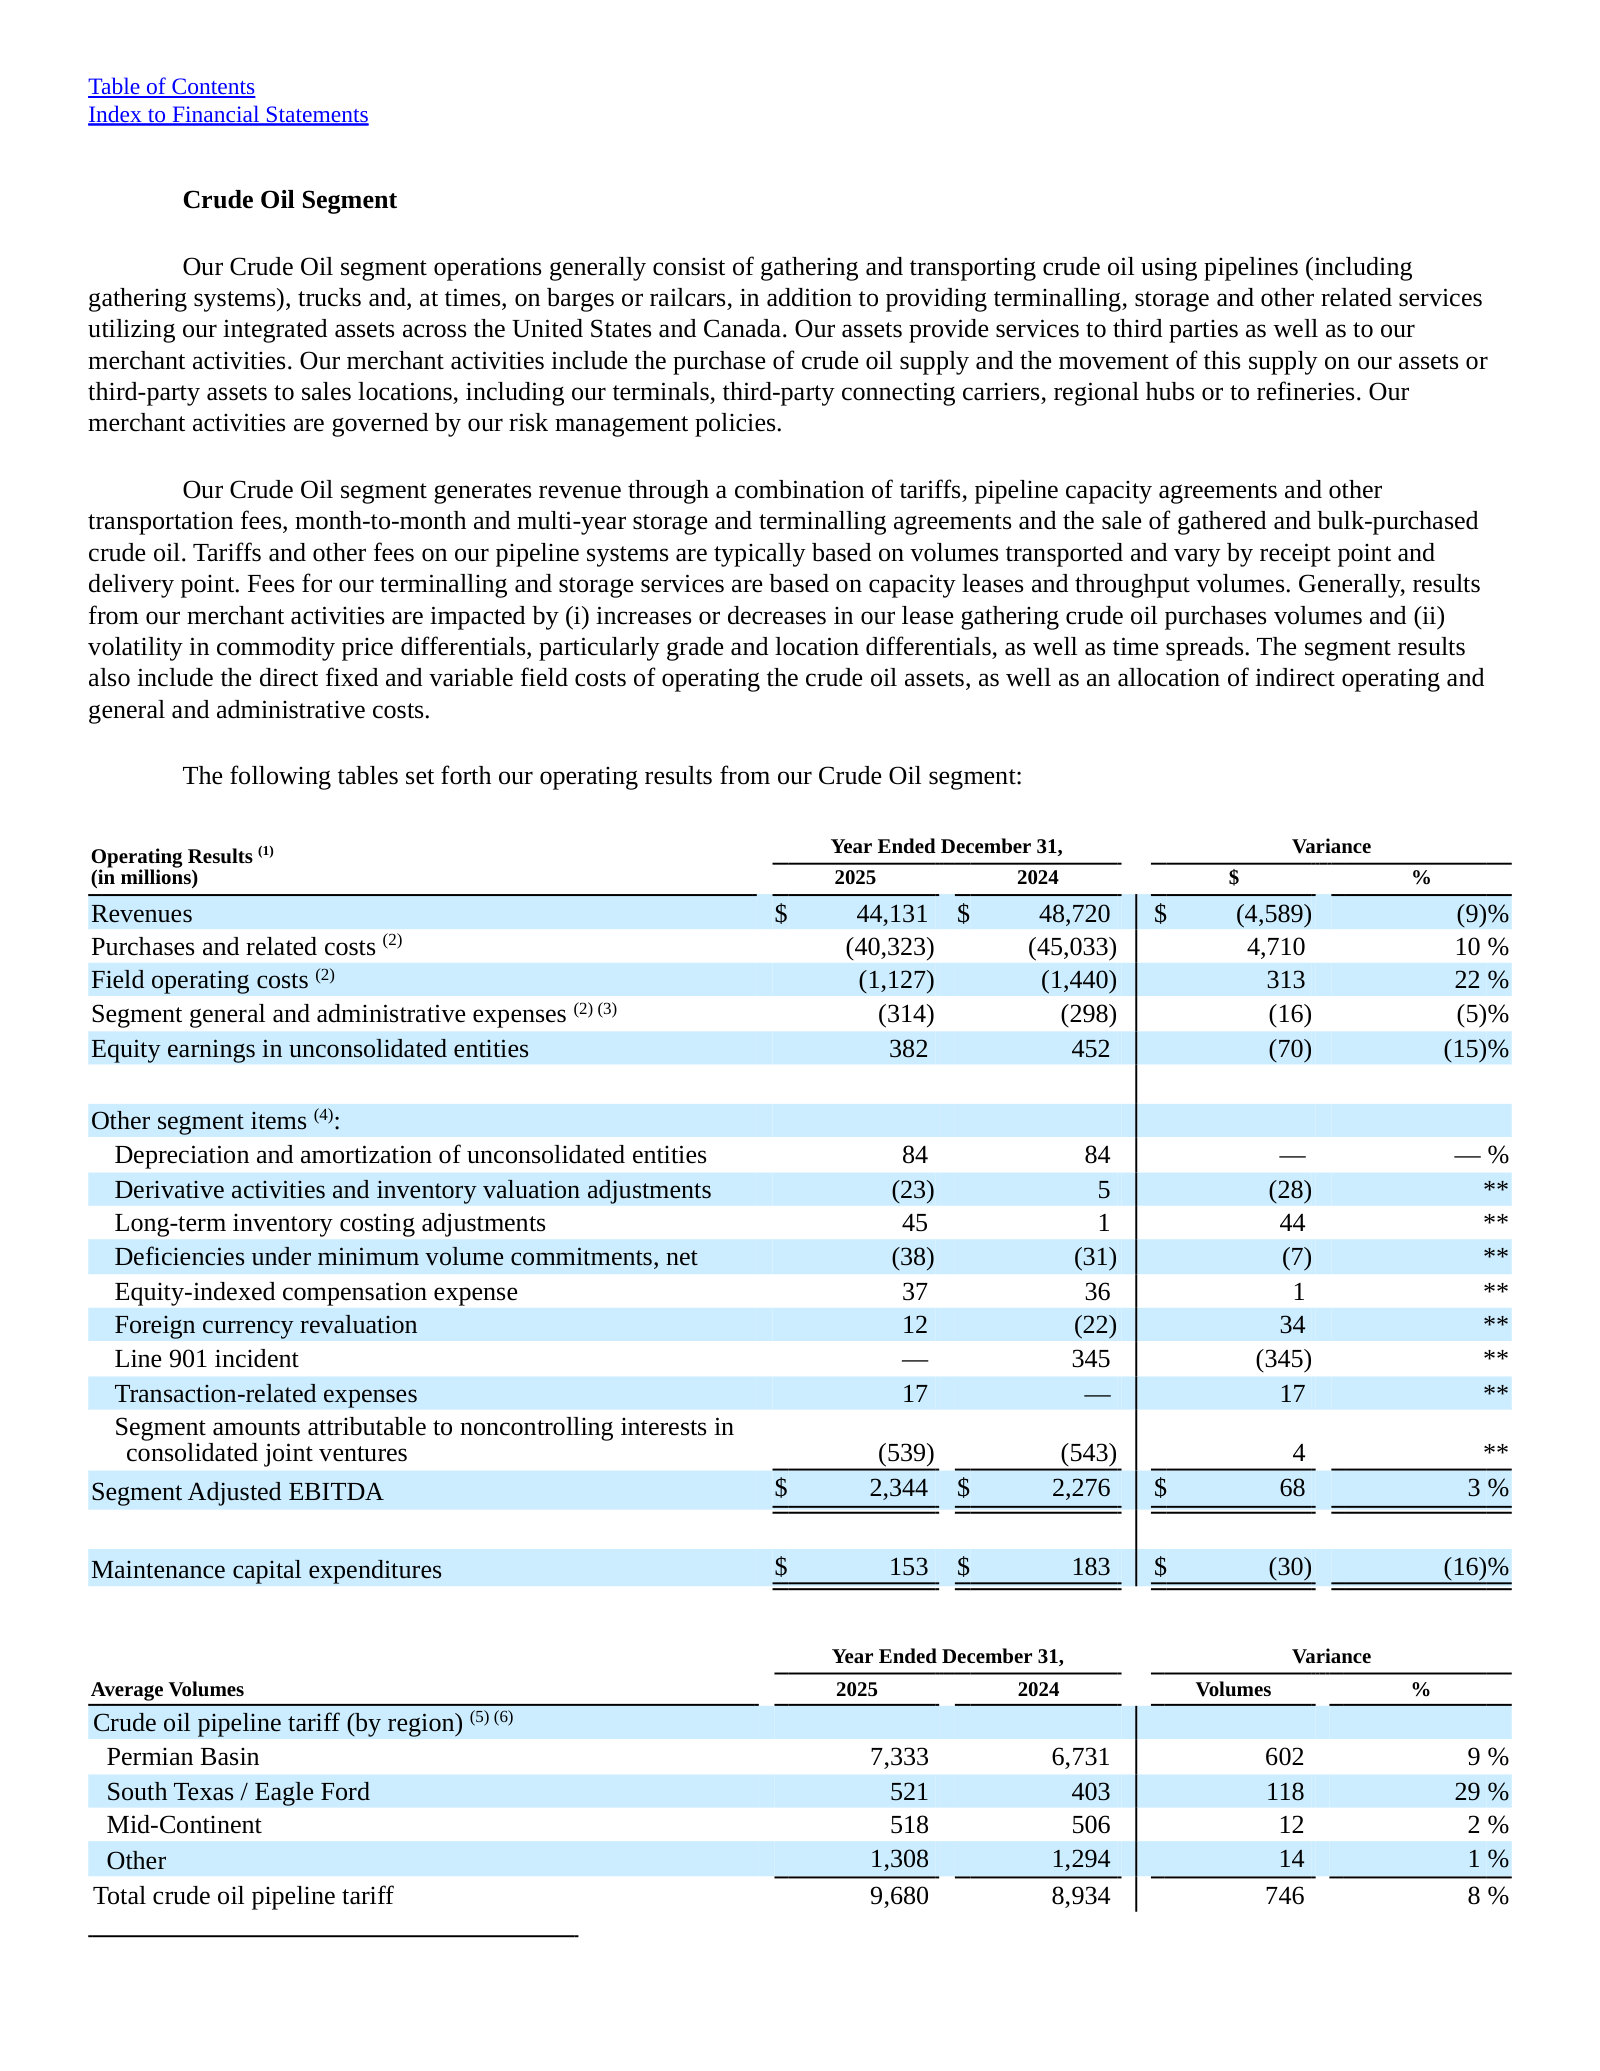
What moved Crude Oil Segment Adjusted EBITDA: Permian volumes and acquisitions against contract resets.
Crude Oil Segment Adjusted EBITDA increased for the year ended December 31, 2025 compared to the year ended December 31, 2024 primarily due to higher tariff volumes on our pipelines, contributions from acquisitions and the benefit of tariff escalations, partially offset by fewer market-based opportunities and the impact from certain contract rates resetting to market. […] Favorable results from (i) volume growth across our pipeline systems largely driven by increased production in the Permian Basin region, (ii) contributions from recently completed acquisitions in the Permian Basin and South Texas regions, including our Cactus III pipeline acquisition, and (iii) the benefit of tariff escalations were partially offset by (iv) fewer market-based opportunities, (v) lower commodity prices, which resulted in lower revenues from pipeline loss allowance in the 2025 periods, and (vi) the impact from certain Permian long-haul contract rates resetting to market in 2025.
p. 128 · Read in context →
Plains GP Holdings, L.P. — FY2024 Annual Report (Form 10-K) — FY2024
Here for one section: the NGL segment as reported before the Keyera sale, when it was a frac-spread and heating-season business. · Open the full document →
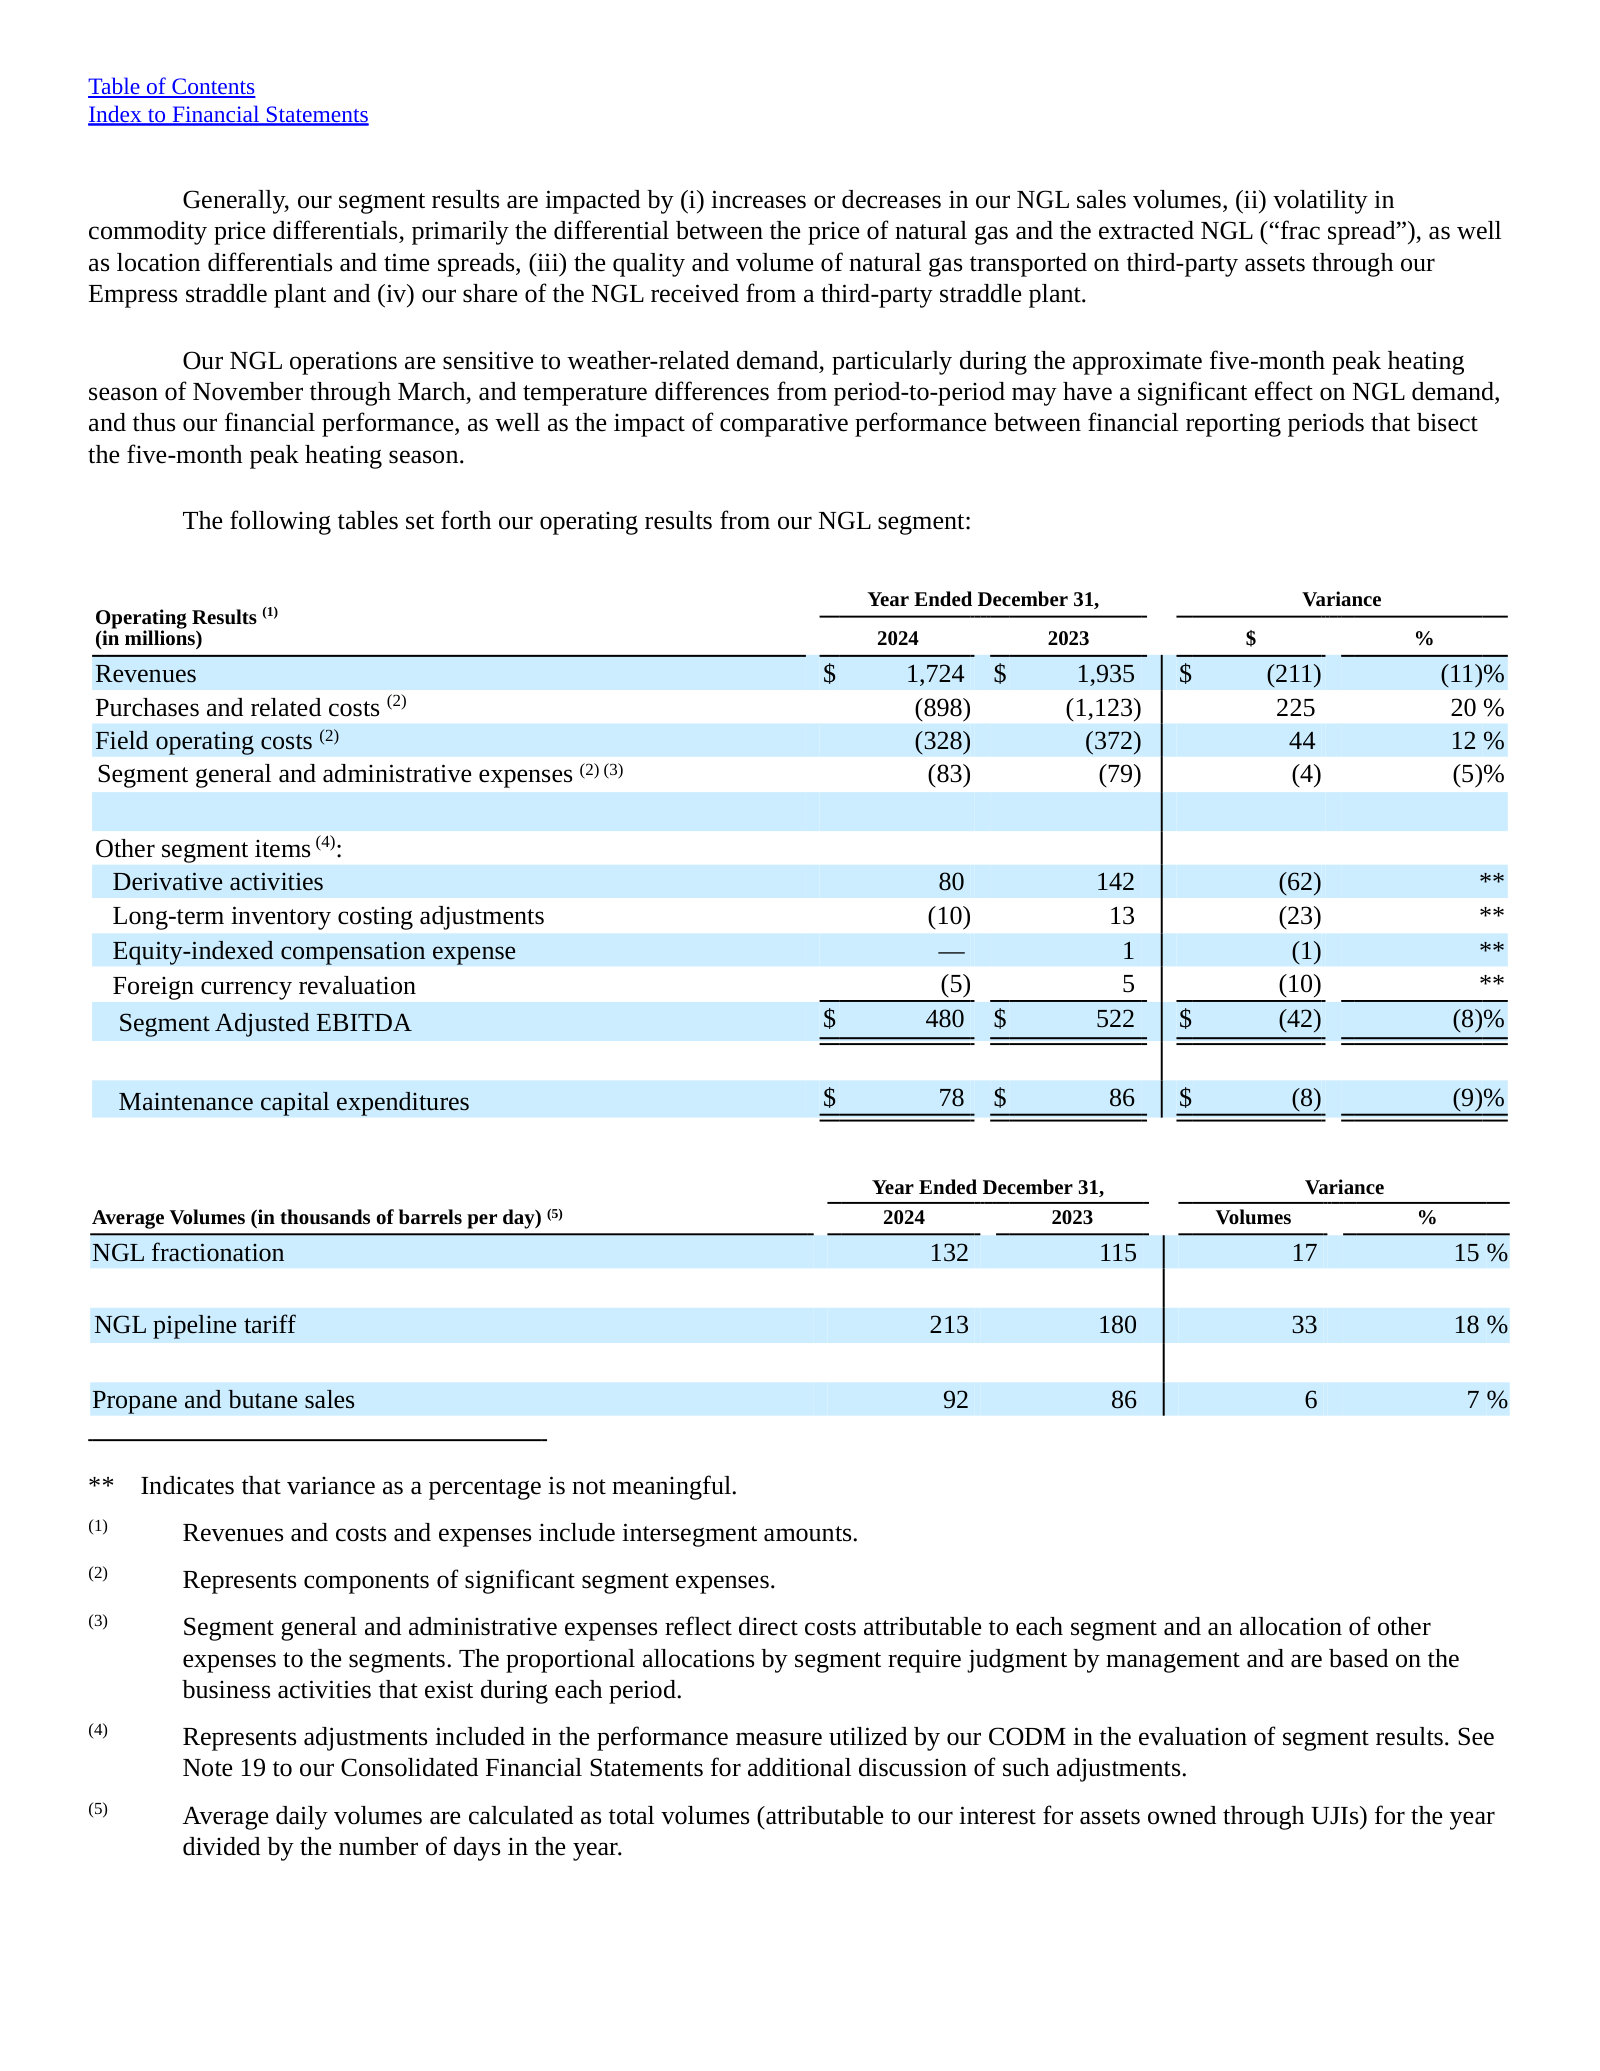
Analysis of Operating Segments — NGL Segment — p. 124 · Read the full section →
Shows what the divestiture removes: $1.7bn of revenue and $480m of Segment Adjusted EBITDA driven by frac spread and winter demand.
The pre-sale NGL earnings drivers: frac spread, straddle-plant gas quality, and a five-month heating season.
Generally, our segment results are impacted by (i) increases or decreases in our NGL sales volumes, (ii) volatility in commodity price differentials, primarily the differential between the price of natural gas and the extracted NGL (“frac spread”), as well as location differentials and time spreads, (iii) the quality and volume of natural gas transported on third-party assets through our Empress straddle plant and (iv) our share of the NGL received from a third-party straddle plant. […] Our NGL operations are sensitive to weather-related demand, particularly during the approximate five-month peak heating season of November through March, and temperature differences from period-to-period may have a significant effect on NGL demand, and thus our financial performance, as well as the impact of comparative performance between financial reporting periods that bisect the five-month peak heating season.
p. 126 · Read in context →
More annual reports
Plains GP Holdings, L.P. — FY2023 Annual Report (Form 10-K) — FY2023 · 249 pages · Baseline year for the FY2025 comparatives, with the NGL segment still consolidated and the Permian JV ramping. · Open →
Plains GP Holdings, L.P. — FY2022 Annual Report (Form 10-K) — FY2022 · 265 pages · The peak-price year: shows how much of the segment result comes from differentials rather than fee-based volume. · Open →
Plains GP Holdings, L.P. — FY2021 Annual Report (Form 10-K) — FY2021 · 275 pages · First 10-K under the Crude Oil / NGL segment presentation, and the last with the distribution at its post-cut level. · Open →
Source: S&P Capital IQ transcripts via Xpressfeed · latest indexed call 2026-05-08 · generated 2026-08-03.
Latest call digest
Plains All American Pipeline, L.P., Plains GP Holdings, L.P., Q1 2026 Earnings Call, May 08, 2026 · 2026-05-08T14:00:00
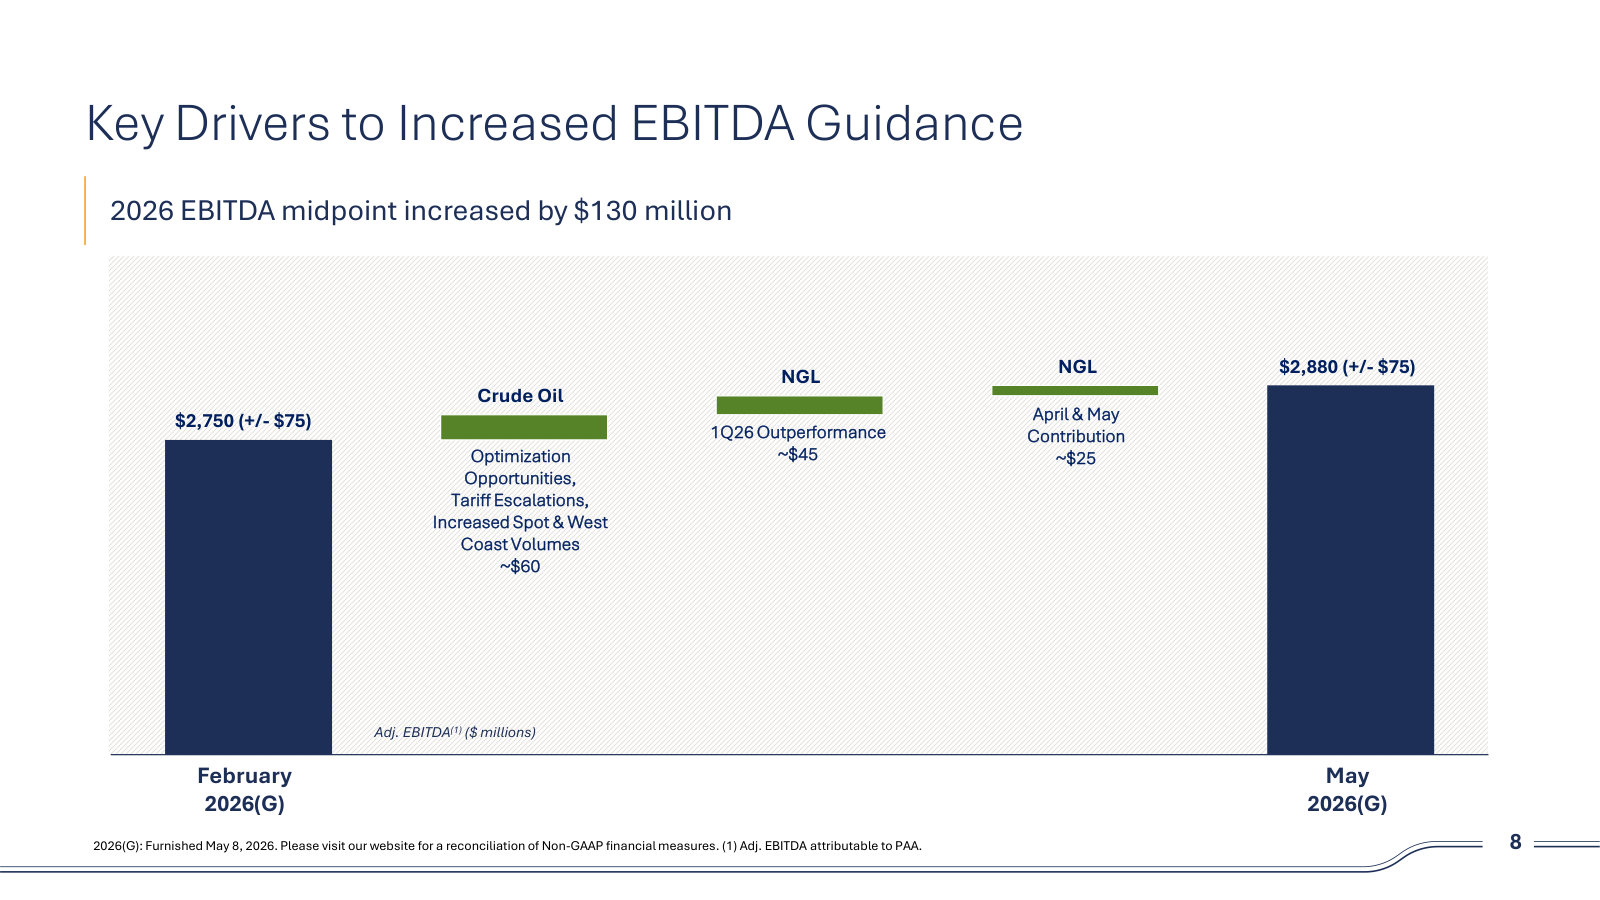
Q1 2026 call, May 8, 2026. Plains reported first quarter adjusted EBITDA attributable to Plains of $730 million and raised the midpoint of full year 2026 adjusted EBITDA guidance by $130 million to $2.88 billion. The prepared remarks led with macro rather than results: management framed the quarter around the closure of the Strait of Hormuz, drawdowns of floating storage and strategic reserves, and a longer-term restocking cycle it believes will support prices and producer activity.
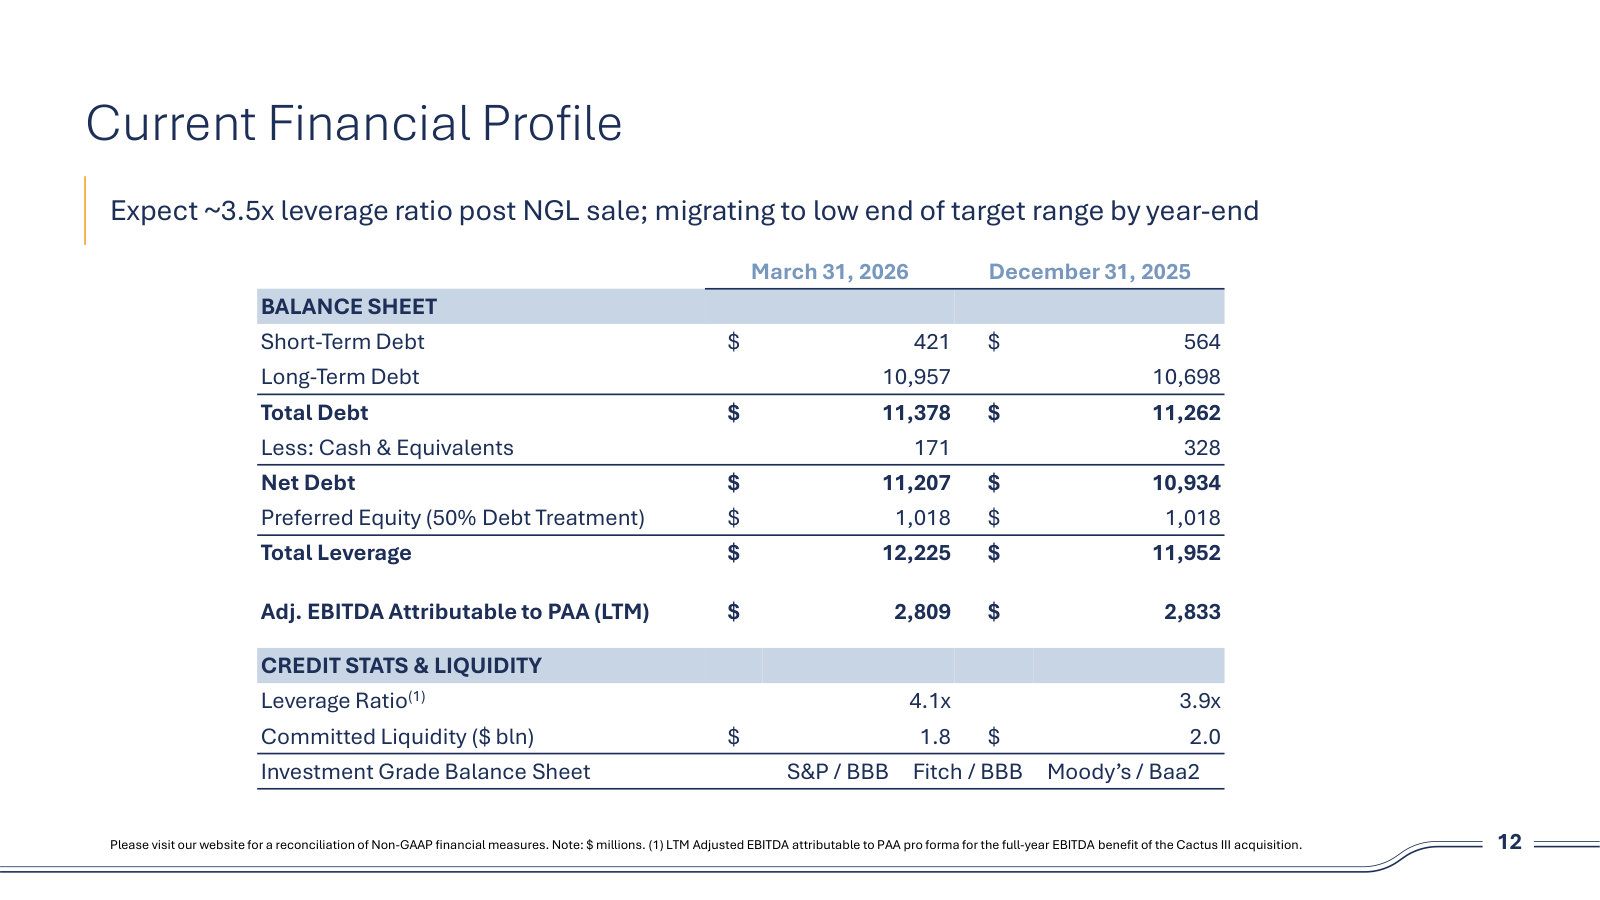
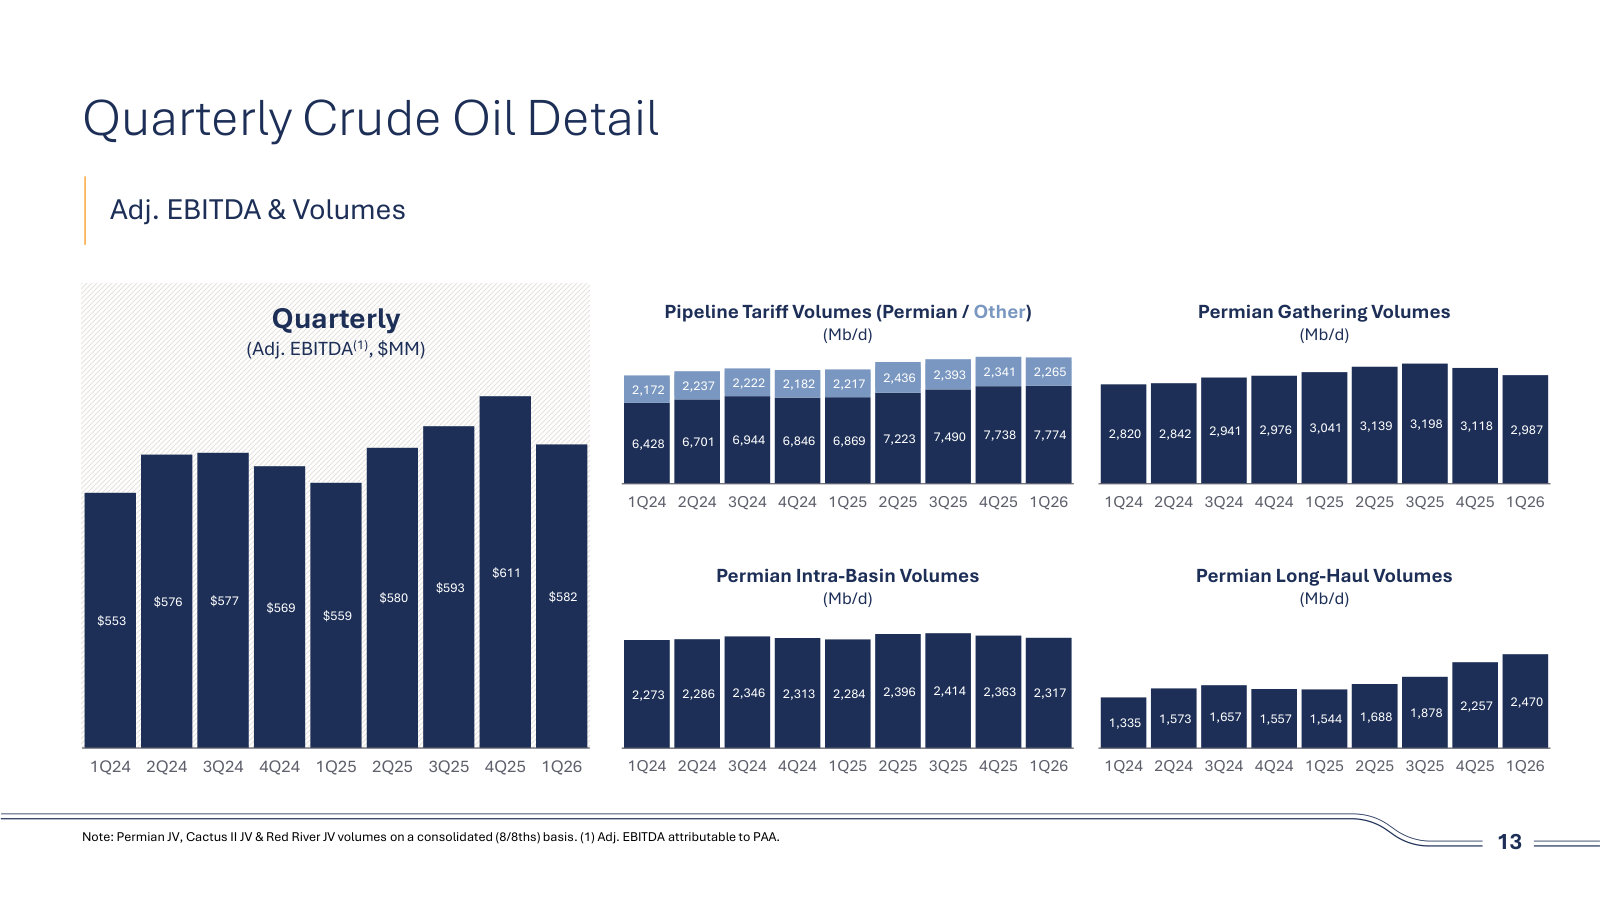
The guidance raise splits into $70 million from the NGL segment (first quarter outperformance of $45 million plus an NGL divestiture close now pushed to May 2026, lifting segment EBITDA to $170 million) and $60 million from the oil segment (captured optimization, FERC escalators, spot tariff volumes, West Coast volumes). Crude segment EBITDA of $582 million was described as broadly in line with plan after winter weather, maintenance and MVC timing. Growth capital stays at $350 million; maintenance capital rises to $185 million on the later NGL close. Pro forma first quarter leverage was 4.1x, falling to roughly 3.5x on the NGL sale, with management targeting the low end of the 3.25x–3.75x range by year end. Net NGL proceeds are now put at approximately $3.3 billion, and the previously flagged special distribution is no longer expected because Cactus III mitigated the unitholder tax liability.
Two gaps between the script and the Q&A stand out. First, management pre-emptively removed the pending Keyera transaction from scope, disclosing that the Competition Bureau has sued while both parties still target closing this month, and asking analysts to refrain from questions on it — no analyst raised it. Second, the macro bullishness in the prepared remarks is not carried into the numbers: 2026 guidance still assumes Permian production relatively flat year-over-year, management said it has not yet seen a meaningful shift in U.S. producer behavior, and any activity response was pushed to 2027 and beyond. The raise itself was described as already substantially secured rather than price-driven, with genuine commodity upside held back as a second-half option.
The hardest exchange was the first one. Scotiabank pressed on why the crude contribution is not higher given the published price sensitivity and the higher assumed crude environment; the CFO answered that the company entered the year highly hedged near the original $60–$65 assumption, that the published sensitivity is raw, and that making it meaningful would require disclosing a hedge position Plains does not disclose. Goldman drew the clearest forward commitments outside guidance: the $50 million/$50 million cost program through 2027 is on track, and preferred paydowns and opportunistic repurchases sit behind roughly $3 billion of debt reduction and continued distribution growth.
Participant coverage from the latest call.
| Group | Participants | Count |
|---|---|---|
| Management | Operator; Blake Fernandez — Vice President of Investor Relations, Plains All American Pipeline, L.P.; Wilfred Chiang — Chairman, President & CEO of PAA GP Holdings LLC, Plains GP Holdings, L.P.; Al Swanson — Executive VP & CFO of Plains All American GP LLC, Plains All American Pipeline, L.P.; Jeremy Goebel — Executive VP & Chief Commercial Officer of Plains All American GP LLC, Plains All American Pipeline, L.P.; Chris Chandler — Executive VP & COO of Plains All American GP LLC, Plains All American Pipeline, L.P. | 6 |
| Analysts | Brandon Bingham — Analyst, Scotiabank Global Banking and Markets, Research Division; Gabriel Moreen — Managing Director of Americas Research, Mizuho Securities USA LLC, Research Division; Manav Gupta — Analyst, UBS Investment Bank, Research Division; Michael Blum — Former Managing Director and Senior Analyst, Wells Fargo Securities, LLC, Research Division; Jeremy Tonet — Senior Analyst, JPMorgan Chase & Co, Research Division; Jacqueline Koletas — Research Analyst, Goldman Sachs Group, Inc., Research Division | 6 |
Curated latest-call exchanges; one row per analyst topic.
| Analyst | Firm | Topic | What changed in Q&A |
|---|---|---|---|
| Brandon Bingham | Scotiabank | Why the crude guide did not rise more with prices | Asked what is baked into the raised guide given the published crude sensitivity. The CFO said the year was entered highly hedged near the original $60-$65 assumption, called the disclosed sensitivity raw, and said the first quarter and the nine-month guide are very minimally affected by actual PLA pricing. The hedge position itself was not sized. |
| Brandon Bingham | Scotiabank | Epic/Cactus III expansion under a better macro | Management pointed to constructive dialogue with existing and new customers, said the near-term result is spot activity, and said longer term it expects to contract at higher rates than before. No sanction, size or timing was given beyond hoping for updates in coming quarters. |
| Gabriel Moreen | Mizuho | Permian growth outlook for 2027 | Asked whether prior 200,000 barrels a day of growth could move materially higher in 2027. The CEO declined a formal guide, said activity picks up above roughly $75 WTI, and repeated that the 2026 assumption is flat. Management added an estimate of 200,000 to 300,000 barrels a day behind pipe in the Permian awaiting gas takeaway. |
| Gabriel Moreen | Mizuho | Durability of marketing and storage optimization | Asked about spreads, dock value and backwardation. Management declined to discuss specific strategies, said what is in the forecast has been substantially captured, and cautioned the volatility is only 60 to 70 days old and hard to forecast forward. |
| Manav Gupta | UBS | Whether the quarter's weather and MVC drag reverses | Management separated the two: shut-in production from weather cannot be made back, though flush production returns, while the MVC timing is expected to be recovered as long-haul volumes have reversed. The CEO confirmed the negative $49 million bridge item contains one-time events that will not recur. |
| Manav Gupta | UBS | Drivers of the NGL segment beat | Attributed to higher border flows into Empress on full Canadian storage, which lifted unhedged straddle production, plus better frac spreads late in the quarter. Management said both have continued into the second quarter, which is what funds the raised NGL guide through closing. |
| Michael Blum | Wells Fargo | Composition of the crude guidance increase | Asked whether the raise is locked-in optimization plus PLA, and whether sustained higher prices would add further upside. The CEO confirmed the numbers reflect captured optimization that actualizes through the year and said a stronger macro would create upside beyond the guide. |
| Jeremy Tonet | JPMorgan | Producer activity and what would trigger rig adds | Management said 15 rigs have been added back but flaring limits throttle near-term response, so rigs added now would affect 2027. It argued physical crude and product markets are tighter than the financial curve implies and that producers are waiting on the back end of the curve before recommitting stacked services. |
| Jeremy Tonet | JPMorgan | Basis and future egress expansion | Management called the setup constructive for basis, citing premium pricing at efficient Corpus docks and new waterborne buyers. On Cactus III it stressed expansion can be phased to match demand rather than sanctioned as one binary step. |
| Jacqueline Koletas | Goldman Sachs | Cost reduction progress and upside | Management said it is on track for $50 million by the end of 2026 and another $50 million in 2027, that some changes are already made, and that it is not prepared to raise the $100 million target through 2027 even though it keeps looking for more. |
| Jacqueline Koletas | Goldman Sachs | When capital allocation shifts from debt paydown to buybacks and preferreds | The CFO sequenced it: roughly $3 billion of debt reduction from NGL proceeds covering the term loan, commercial paper and a $750 million note, landing at about 3.5x, then distribution growth and investment first, with preferred takeouts and opportunistic repurchases only once leverage sits at or below the bottom of the range. |
Theme tracker
Themes are curator-classified across supplied calls.
| Theme | Status | Quarters mentioned | Read-through |
|---|---|---|---|
| Permian production trajectory | persisted | Q2 2023, Q3 2023, Q4 2023, Q1 2024, Q2 2024, Q3 2024, Q4 2024, Q1 2025, Q2 2025, Q3 2025, Q4 2025, Q1 2026 | Present on every call, but the content inverted. Management guided 200,000 to 300,000 barrels a day of exit-to-exit growth for both 2024 and 2025, walked 2025 down to the lower half of the range during the year, then forecast the Permian relatively flat for 2026 and repeated that assumption in the latest call. The recurring question changed from how much growth to when growth resumes. |
| Bolt-on M&A and efficient growth | persisted | Q2 2023, Q3 2023, Q4 2023, Q1 2024, Q2 2024, Q3 2024, Q4 2024, Q1 2025, Q2 2025, Q3 2025, Q4 2025, Q1 2026 | The named bolt-on program headlined every call through Q4 2025, with size creeping up from bite-size gathering deals to the $2.9 billion Cactus III purchase. The latest call still commits to evaluating organic and inorganic opportunities against return thresholds, but frames them as one input to future return of capital rather than as the standalone growth engine. |
| Permian long-haul recontracting and rate resets | persisted | Q2 2023, Q3 2023, Q4 2023, Q1 2024, Q2 2024, Q3 2024, Q4 2024, Q2 2025, Q3 2025, Q4 2025, Q1 2026 | Ran from the pre-announcement uncertainty of 2023, through the Q1 2024 disclosure of Cactus I terms consistent with $1.25 to $1.50 per barrel, to the actual step-down landing in the second half of 2025, which management told investors to treat as the fourth quarter baseline. The latest call is the first to describe recontracting as a chance to price above prior levels rather than below. |
| Distribution coverage threshold and return of capital | persisted | Q3 2023, Q4 2023, Q4 2024, Q1 2025, Q3 2025, Q4 2025 | The 160% coverage target set in late 2022 was defended repeatedly, including on the Q3 2025 call, then cut to 150% at Q4 2025 alongside a 10% distribution increase to $1.67 per unit annualized. That cut drew the densest questioning of any topic in the recent history. It went unmentioned in the latest call, where the return-of-capital question was reframed around debt paydown sequencing. |
| Canadian NGL divestiture and the Keyera transaction | emerged | Q2 2025, Q3 2025, Q4 2025, Q1 2026 | Announced in June 2025 at approximately USD 3.75 billion and dominant since. The expected close slipped from the first quarter of 2026 to near the end of the first quarter, then to May 2026, and the Competition Bureau has now sued. Proceeds were effectively pre-spent on Cactus III, so the sale reads as a funding and tax event rather than a deleveraging windfall. |
| NGL frac spread hedging disclosure | dropped | Q2 2023, Q3 2023, Q4 2023, Q2 2024, Q4 2024, Q1 2025 | For two years management routinely disclosed C3+ spec product hedge percentages and realized frac spread levels, moving from roughly 90% hedged in the mid-$0.60s for 2024 to about 80% for 2025. That disclosure disappeared once the NGL sale was announced. The commodity sensitivity that replaced it, the crude PLA position, is deliberately not sized. |
| Streamlining and the $100 million cost program | emerged | Q3 2025, Q4 2025, Q1 2026 | Cost efficiency was previously described as continuous and unquantified. It became a numbered target at Q4 2025 — $100 million of annual savings through 2027, roughly half in 2026 — and is now one of the three named 2026 initiatives alongside closing the NGL sale and Cactus III synergies. It matters because self-help, not volume, carries the 2026 growth case. |
| Trade tariffs as a planning variable | dropped | Q4 2024, Q1 2025 | Tariffs on Canadian energy were a scenario-planning topic on two consecutive calls, with management saying the impact fit inside the guidance range and that USMCA exemptions limited direct exposure. The subject has not returned on any call since, and no resolution was ever narrated. |
| Line 901 legal and insurance overhang | dropped | Q3 2024, Q4 2024 | Management settled the remaining suits in Q3 2024, then wrote off the full $225 million insurance receivable at Q4 2024 after an adverse arbitration ruling. Neither the claim nor the possibility of future recoveries has been raised since, which is consistent with the matter being closed rather than deferred. |
| Geopolitical supply disruption as an earnings driver | emerged | Q4 2025, Q1 2026 | Earlier calls treated geopolitics as background volatility. Venezuela entered the Q4 2025 discussion as a heavy-barrel and quality-optimization variable, and the latest call opens with the closure of the Strait of Hormuz as the reason the macro has changed. Management now argues the disruption pushes buyers toward North American supply and raises the value of existing infrastructure. |
Guidance ledger
Quotes, calls, and speakers are source-verified; outcomes are curator-classified.
| Verbatim guidance | Call | Speaker | Curator outcome | Outcome note |
|---|---|---|---|---|
| “we're raising the midpoint of our full year 2024 adjusted EBITDA guidance by $75 million to a new range of $2.725 billion to $2.775 billion” | Plains All American Pipeline, L.P., Plains GP Holdings, L.P., Q2 2024 Earnings Call, Aug 02, 2024 · 2024-08-02T14:00:00 | Willie Chiang | kept | The Q4 2024 call reported full year adjusted EBITDA attributable to Plains of $2.78 billion, just above the high end of the raised range. |
| “we provided adjusted EBITDA guidance of $2.8 billion to $2.95 billion, or approximately 3% growth year-over-year at the midpoint of our guidance range” | Plains All American Pipeline, L.P., Plains GP Holdings, L.P., Q4 2024 Earnings Call, Feb 07, 2025 · 2025-02-07T15:00:00 | Willie Chiang | kept | Full year 2025 adjusted EBITDA of $2.833 billion, reported on the Q4 2025 call, landed inside the original range though below its midpoint. |
| “we expect Permian crude production to grow 200,000 to 300,000 barrels a day year end '24 to year end '25, with overall basin volumes growing to approximately 6.7 million barrels a day by the end of 2025” | Plains All American Pipeline, L.P., Plains GP Holdings, L.P., Q4 2024 Earnings Call, Feb 07, 2025 · 2025-02-07T15:00:00 | Willie Chiang | missed | Guidance was cut to the lower half of the range during 2025. The Q4 2025 call put end-2025 basin volumes at about 6.6 million barrels a day, below the 6.7 million forecast. |
| “We are narrowing our full year 2025 adjusted EBITDA guidance range to $2.84 billion to $2.89 billion” | Plains All American Pipeline, L.P., Plains GP Holdings, L.P., Q3 2025 Earnings Call, Nov 05, 2025 · 2025-11-05T15:00:00 | Al Swanson | missed | Reported full year 2025 adjusted EBITDA was $2.833 billion, marginally below the low end of the narrowed range set one quarter earlier. |
| “we are providing adjusted EBITDA guidance of $2.75 billion net to Plains at the midpoint plus or minus $75 million” | Plains All American Pipeline, L.P., Plains GP Holdings, L.P., Q4 2025 Earnings Call, Feb 06, 2026 · 2026-02-06T15:00:00 | Willie Chiang | pending | Superseded one quarter later: the Q1 2026 call raised the midpoint by $130 million to $2.88 billion. The full year outcome is not yet in the call history. |
| “it's $100 million run rate by the end of 2027. So we expect to achieve $50 million of that in 2026 and another $50 million in 2027.” | Plains All American Pipeline, L.P., Plains GP Holdings, L.P., Q4 2025 Earnings Call, Feb 06, 2026 · 2026-02-06T15:00:00 | Chris Chandler | pending | Reaffirmed on the Q1 2026 call as on track, with management declining to raise the target despite saying there is always upside. |
| “we now expect a special distribution of $0.15 per unit or less after closing and pending Board approval” | Plains All American Pipeline, L.P., Plains GP Holdings, L.P., Q4 2025 Earnings Call, Feb 06, 2026 · 2026-02-06T15:00:00 | Al Swanson | kept | On the Q1 2026 call management said Cactus III mitigated the unitholder tax liability and that no special distribution is now expected, which sits inside the stated ceiling. |
| “we're increasing the midpoint of our full year 2026 adjusted EBITDA guidance by $130 million to $2.88 billion” | Plains All American Pipeline, L.P., Plains GP Holdings, L.P., Q1 2026 Earnings Call, May 08, 2026 · 2026-05-08T14:00:00 | Wilfred Chiang | pending | Most recent guidance; no later call in the supplied history. Management attributes $70 million to the NGL segment and $60 million to the oil segment. |
| “we would expect leverage to migrate towards the low end of our target range of 3.25x to 3.75x by the end of the year” | Plains All American Pipeline, L.P., Plains GP Holdings, L.P., Q1 2026 Earnings Call, May 08, 2026 · 2026-05-08T14:00:00 | Al Swanson | pending | Pro forma first quarter leverage was 4.1x, falling to roughly 3.5x on the NGL sale. Verification depends on the sale closing and on debt paydown. |
| “We expect net proceeds from the NGL sale to be approximately $3.3 billion, which is approximately $100 million higher than our prior estimate” | Plains All American Pipeline, L.P., Plains GP Holdings, L.P., Q1 2026 Earnings Call, May 08, 2026 · 2026-05-08T14:00:00 | Al Swanson | pending | Contingent on a close management targets for this month while the Competition Bureau challenge is outstanding. |
Q&A pressure map
Question counts and firms are curator tallies; analyst coverage shown above.
| Topic | Questions | Firms | Pressure / response |
|---|---|---|---|
| Distribution coverage threshold and return-of-capital sequencing | 12 | Wells Fargo, Wolfe Research, Scotiabank, Seaport Research Partners, UBS, Goldman Sachs | The most persistently worked topic across the last four calls. Analysts probed whether the cut from 160% to 150% coverage was formulaic, whether it implies a committed multi-year runway of $0.15 increases, and whether coverage should be judged on free cash flow rather than DCF. On the 150%-versus-lower question, management said not to read too much into the delta and pointed to peers, which does not answer the request for a framework. |
| Cactus III synergy capture and expansion economics | 6 | Wells Fargo, Wolfe Research, TPH Research, UBS, Scotiabank | Repeated attempts to pin down how much of the value is cost versus commercial, what capital an expansion needs, and when it gets sanctioned. Management has consistently answered with the phased, non-binary framing and the $50 million synergy figure, but has not given expansion size, cost or timing on any call. |
| Permian production trajectory and producer response | 6 | Scotiabank, JPMorgan, Mizuho | Analysts kept testing whether the flat 2026 assumption is conservative. Management's answers are consistent and specific about the constraint — gas takeaway and flaring limits, barrels behind pipe, a price threshold around $75 WTI — while declining a formal forward guide and pushing any activity benefit into 2027. |
| What is actually inside the guidance number | 5 | Citigroup, Scotiabank, TPH Research, Wells Fargo | A recurring attempt to reconcile the published sensitivities with the guide. The clearest mismatch came on the latest call: asked why the crude contribution is not higher given price moves, the CFO said the disclosed sensitivity is raw and that making it meaningful would require disclosing the hedge position, which Plains does not do. The question about the size of the price benefit was not answered. |
| Long-haul contracting, rates and Gulf Coast egress | 5 | Mizuho, Seaport Research Partners, BofA Securities, Goldman Sachs, JPMorgan | Covers BridgeTex, the volume-versus-margin mix after the rate reset, Corpus versus Houston, and basis. Management engages on direction and on why Corpus retains a quality and logistics premium, but treats specific rates and open capacity as commercially sensitive. |
| NGL divestiture closing mechanics | 4 | Seaport Research Partners, Goldman Sachs, JPMorgan, UBS | Earlier calls drew questions on retained U.S. NGL assets, FX hedging on the Keyera proceeds and the regulatory gating item. On the latest call management pre-empted the topic in prepared remarks, disclosed the Competition Bureau lawsuit and asked analysts to refrain from questions on it; none were asked, so the largest open risk in the story went untested. |
| Cost savings and streamlining execution | 2 | UBS, Goldman Sachs | Lightly pressed relative to its weight in the 2026 growth bridge. Both questions were answered with the same $50 million/$50 million split and an on-track assertion; no interim capture figure has been disclosed. |
Language shifts
Only language evidence verified against the referenced component is shown.
| Observation | Verbatim evidence | Call ID | Component |
|---|---|---|---|
| The latest call introduces supply-disruption vocabulary absent from every prior call in this history. Geopolitics moved from a background risk factor to the opening frame for guidance. | “The closure of the Strait of Hormuz has significantly disrupted global shipping channels and Middle East supply” | 1993685337 | 2 |
| Management's self-description shifted from an offensive posture to an inward, execution-and-cost posture. In February 2025 the CEO characterised the company as having moved to offense. | “we've really moved from defense to offense” | 1915352652 | 8 |
| One year later the same framing is replaced by self-help language, with the growth case resting on three internal initiatives rather than on market conditions. | “2026 will be a year of execution and self-help with a focus on 3 initiatives” | 1977003679 | 2 |
| The Permian volume assumption is now stated flatly and without a range, in contrast to the exit-to-exit growth bands guided for 2024 and 2025. | “we continue to assume Permian crude oil production to be relatively flat year-over-year” | 1993685337 | 3 |
| New hedging caution around optimization upside: the commercial lead framed the captured opportunity set as unforecastable beyond what is already secured, despite the bullish macro in the prepared remarks. | “It's hard – this is a very volatile time period.” | 1993685337 | 15 |
| The CFO explicitly limits the usefulness of the company's own published sensitivity, a disclosure boundary that was not drawn in prior calls where NGL hedge percentages were routinely given. | “the fact that we had hedged quite a bit before entering the year, that sensitivity we give is just a raw sensitivity” | 1993685337 | 8 |
| A conservative buffer set in 2022 and defended as recently as the prior quarter was loosened, described as modest and peer-aligned rather than as a change in policy. | “we are modestly reducing our distribution coverage ratio threshold from 160% to 150%” | 1977003679 | 2 |
| Producer-response timing is pushed out a full year, which is the clearest statement that the improved macro does not reach 2026 results. | “rigs being added now would impact 2027” | 1993685337 | 28 |
The call history supports the bear case on volumes and the bull case on self-help, and the two have not yet met. Management has been reliable on the things it controls — cost targets, synergy capture, deal execution, capital allocation sequencing — and less reliable on basin volumes, having guided 200,000 to 300,000 barrels a day of Permian growth for two straight years before settling on flat for 2026 and missing its own narrowed 2025 EBITDA range. The latest raise is consistent with that pattern: it is sourced from captured optimization, a later NGL close and cost work, not from a production or price response management is willing to underwrite. The open questions the calls do not answer are the Competition Bureau challenge, which management removed from the Q&A, and how much of the improved macro converts into contracted long-haul rates rather than spot.
Competitors describe Plains GP Holdings, L.P.'s market in their own filings and calls. These verified passages and visual pages show where their strategies meet, using source documents preserved in Sources.
ONEOK, Inc. (OKE)
The peer whose crude business collides with Plains most specifically rather than most broadly. After the Magellan, EnLink and Medallion acquisitions ONEOK reports roughly 2,100 miles of crude gathering pipeline in the Permian and Mid-Continent, 1,100 miles of crude transportation pipeline running from the Permian to its East Houston terminal, terminals at Cushing and Corpus Christi and 100 MMBbl of storage — the same wellhead-to-hub chain PAA runs. It is also PAA's counterparty in a jointly governed asset: in July 2025 ONEOK took its BridgeTex interest from 30% to 60%, and PAA's FY2025 Form 10-K lists BridgeTex as a 40%-owned crude oil pipeline joint venture. Exhibits are confined to the Refined Products and Crude segment; ONEOK's natural gas gathering and processing, NGL and natural gas pipeline commentary is out of scope for a crude pure-play reader.
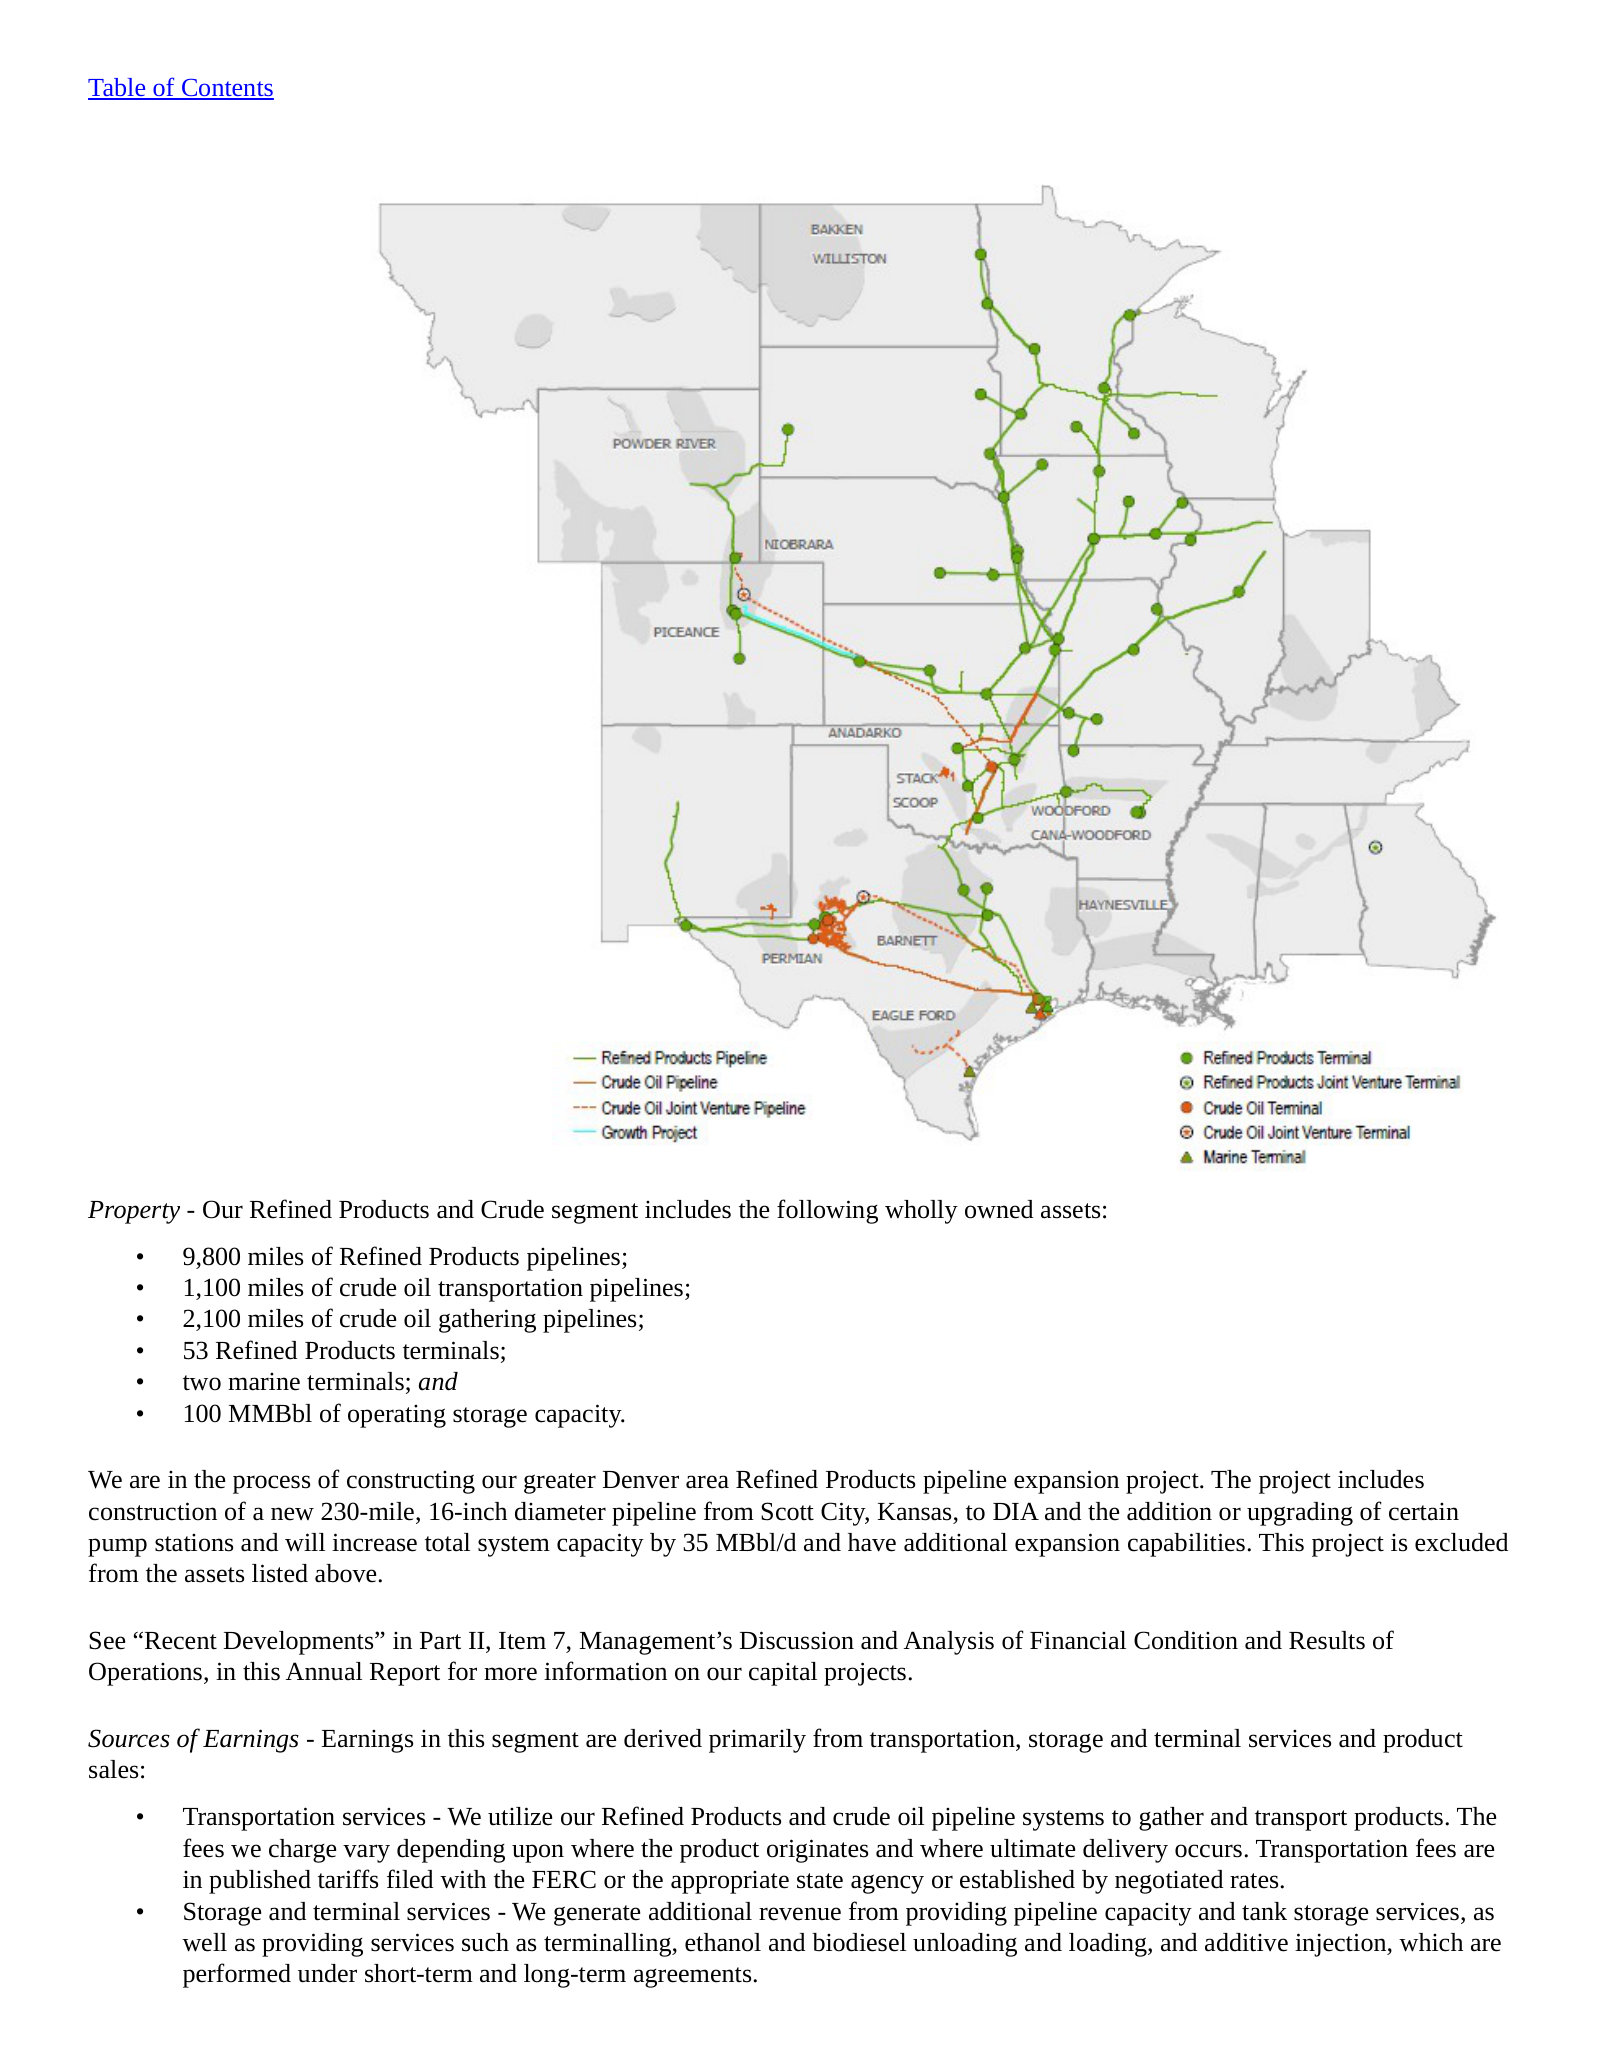
ONEOK's CFO explaining, on the FY2025 second-quarter call, why it doubled its stake in a pipeline Plains part-owns. BridgeTex moves Permian crude to the Houston area; ONEOK went from 30% to 60% and PAA's FY2025 Form 10-K still lists a 40% interest, so the two are now the only partners. Three things are the company's own characterisation rather than measured facts: that the purchase was "opportunistic," that the multiple was attractive "compared to recent transactions in the marketplace" (no multiple or comparable set is given), and that Medallion connectivity justified paying more. ONEOK's Form 10-K puts the cash consideration at approximately $270 million for the additional 30%; a straight grossing-up of that price is a crude read on what the whole entity was worth in mid-2025, and it is not a valuation ONEOK itself asserts. The last sentence is the part that matters structurally for a Plains holder: despite owning 60%, ONEOK says it will not consolidate BridgeTex because the governance arrangement with its remaining partner stays "more of a 50-50 type of governance."
Jeremy Bryan Tonet (Analyst, JPMorgan) and Walter S. Hulse (Chief Financial Officer, Treasurer and Executive Vice President, Investor Relations and Corporate Development, ONEOK): And then just want to pivot towards BridgeTex here. I was wondering if you could provide a bit more color on economics there and synergies as well. And will you be consolidating BridgeTex? […] Well, Jeremy, we were opportunistic here. We had the opportunity to increase our holdings from 30% up to 60% at very attractive multiples compared to recent transactions in the marketplace. Given the connectivity to our Medallion assets, we really thought that it made a lot of sense to continue to get more of that business. No, we will not be consolidating it going forward because we still have a governance structure with our other partner there that keeps it more of a 50-50 type of governance.
p. 6 · Read in context →
The mechanism behind the stake increase, stated plainly by ONEOK's chief commercial officer on the same call. Having gone to 60% of BridgeTex, ONEOK says it is now more economic to route barrels off its own Permian gathering system onto that line "as opposed to sending it through other pipelines," and to capture the downstream value at its East Houston distribution centre. Read as a description of intent rather than a disclosed volume shift: no barrel counts, tariffs or contract terms are given, and gathering-system barrels are frequently subject to existing dedications. It is nonetheless the clearest public statement in this peer set of the dynamic PAA names in its own risk factors — an integrated competitor using ownership of gathering to direct uncommitted barrels away from competing long-haul lines, in a basin PAA describes as already carrying multiple pipeline expansions.
Michael Jacob Blum (Analyst, Wells Fargo) and Sheridan C. Swords (Executive Vice President and Chief Commercial Officer, ONEOK): Just wanted to ask another question on BridgeTex. Just wondering if you can discuss the performance of BridgeTex this quarter. And then obviously, you've increased your position there. So I want to get your view of the outlook for that pipeline over the next couple of years. […] We are observing an increase in volume as we move forward. This pipeline connects directly to our East Houston facility, which also supplies our downstream assets. We continue to see growth in crude oil volume from the Permian, which we believe will lead to increased volume through our system. With our larger share, it becomes more beneficial for us to direct the volume from our field gathering to this system, as opposed to sending it through other pipelines. We decided to increase our stake because we are optimistic about the future. The integration of our assets with the Magellan and EnLink crude systems allows us to utilize our preferred pipelines, enhancing our value capture. This not only helps us transport more oil through our pipeline but also supports our East Houston distribution center, providing us with additional downstream value.
p. 7 · Read in context →
Energy Transfer LP (ET)
The largest crude footprint in the peer set and the one that overlaps Plains at every point on the chain: Permian crude gathering through the ET-S Permian joint venture with Sunoco, long-haul out of the Permian to Nederland, Houston and Cushing, terminals at Cushing and Patoka, and a Bakken-to-Gulf system in Dakota Access. It is also a co-owner alongside PAA in Wink to Webster (5%) and White Cliffs (54.3%), and PAA appears in Energy Transfer's own executive compensation peer group. Energy Transfer's crude oil transportation and services segment reported $2,942 million of segment adjusted EBITDA in 2025. Exhibits are limited to that crude segment; the natural gas, NGL, LNG, Sunoco and USA Compression material — most of the company — is left out.
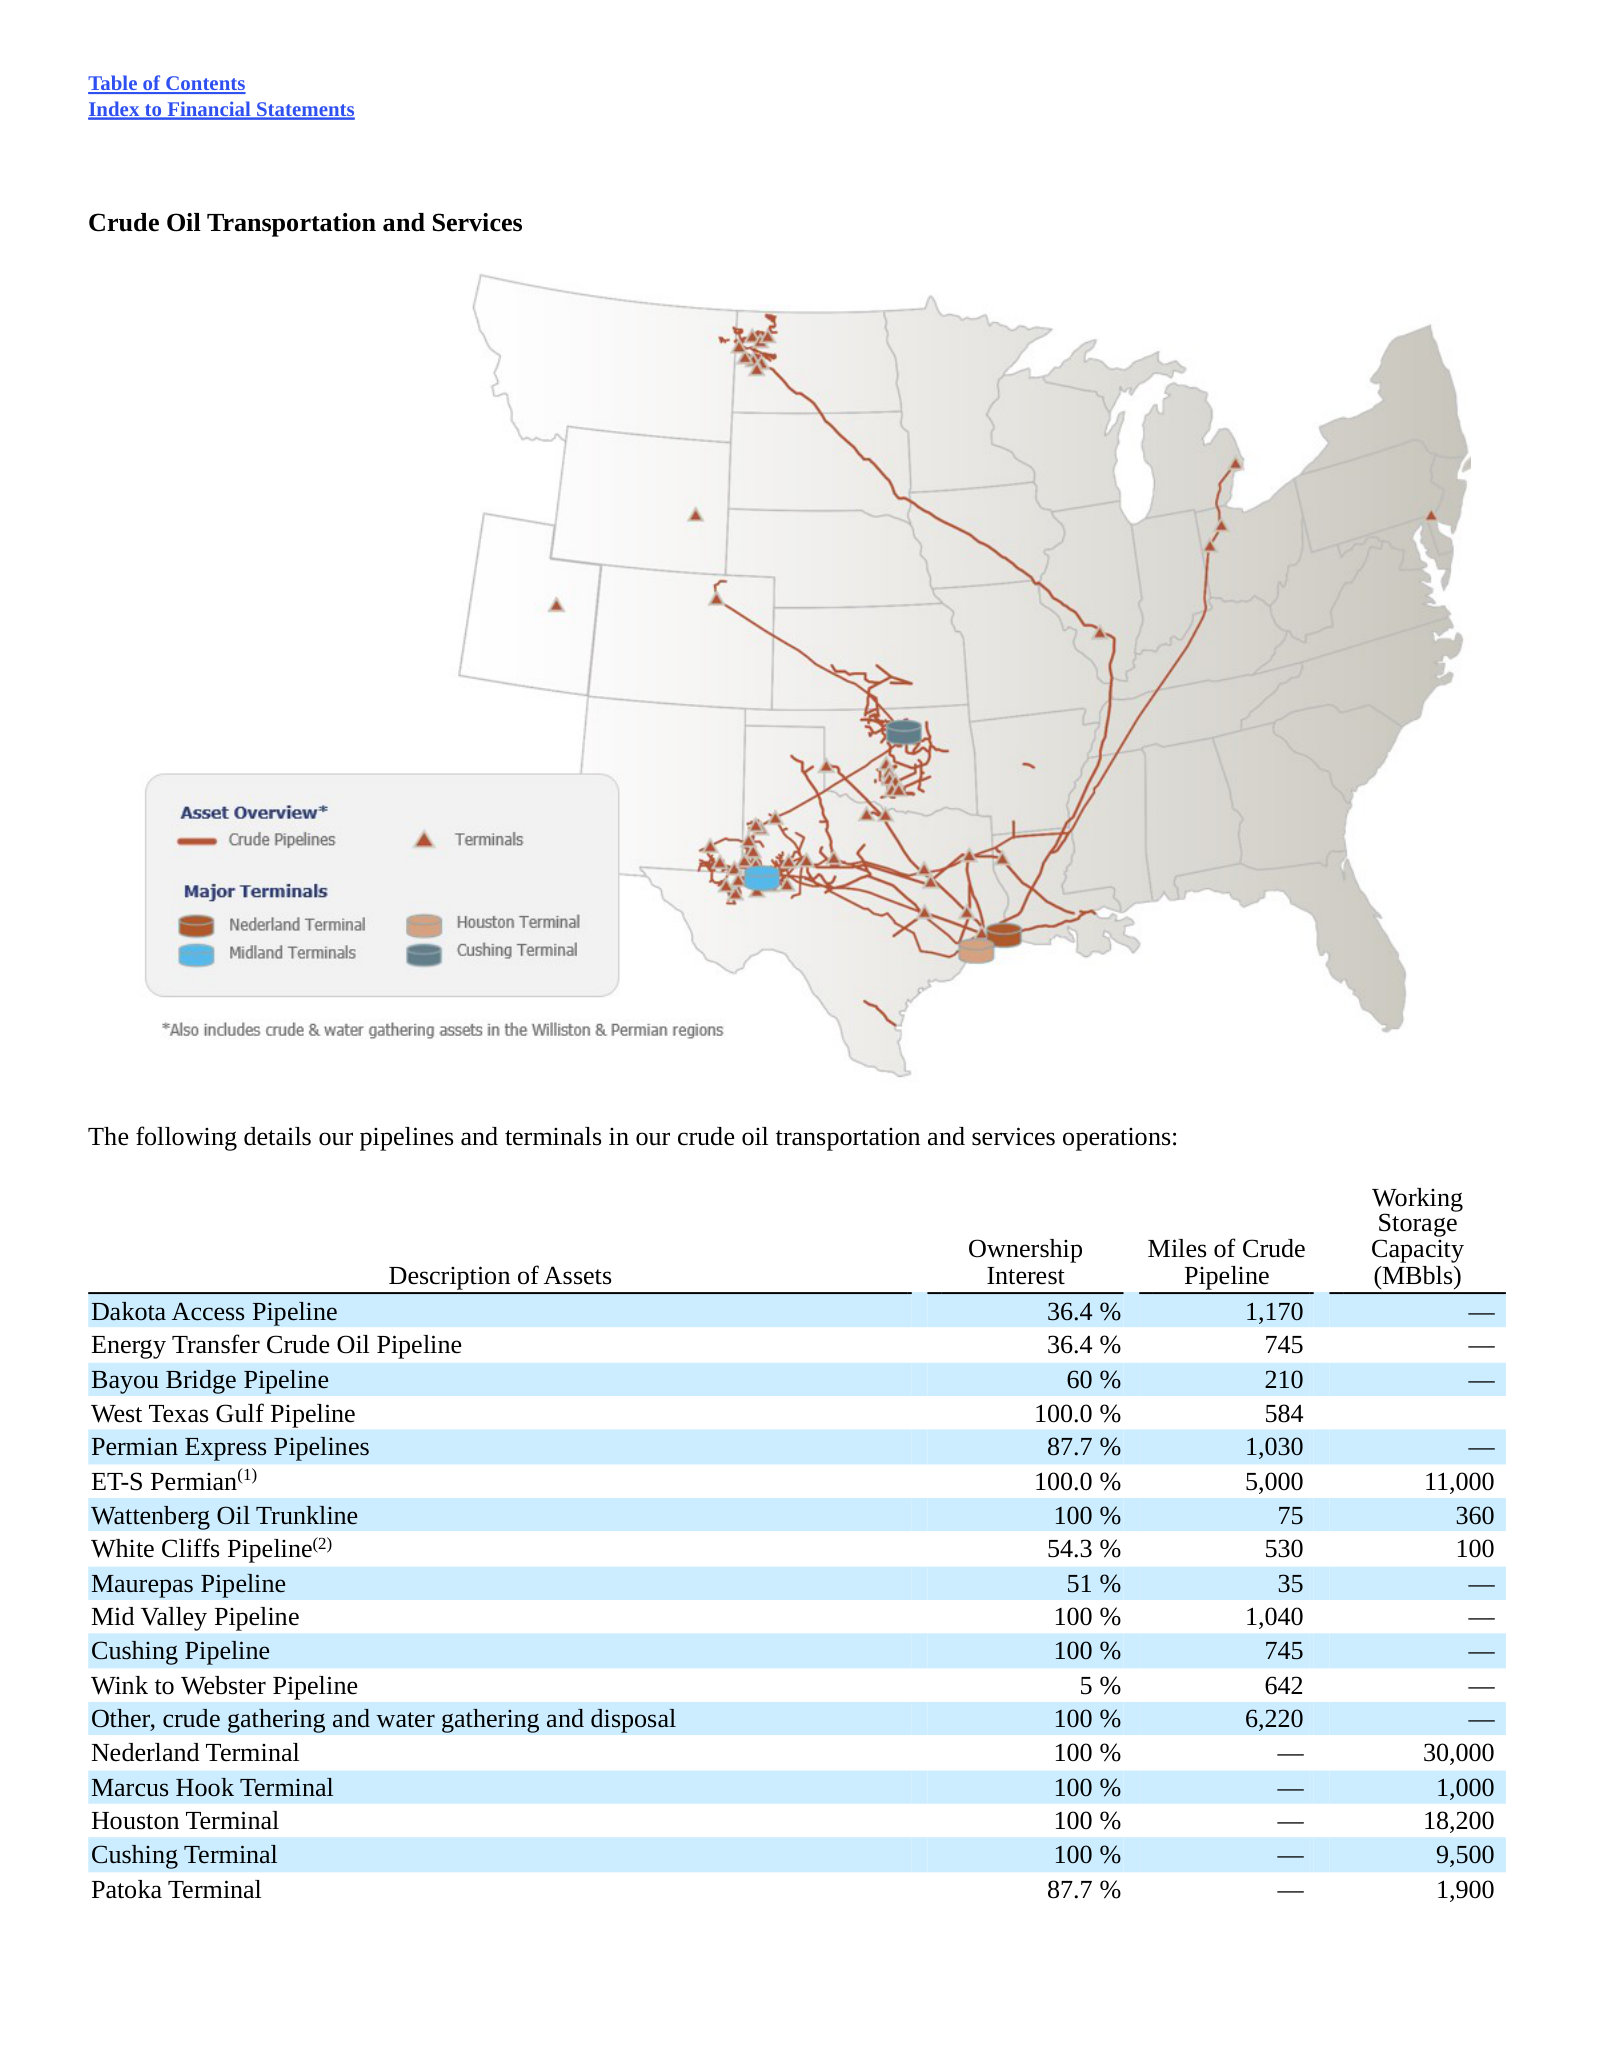
Energy Transfer's description, in the notes to its FY2025 financial statements, of the vehicle that now holds its Permian crude gathering — the structural analogue of PAA's own Permian gathering joint venture. Two disclosures are worth isolating. First, the perimeter: Energy Transfer's long-haul pipelines out of the Permian to Nederland, Houston and Cushing are explicitly carved out of ET-S Permian, so the joint venture is a gathering business and the long-haul economics stay with the parent. Second, the scale: more than 5,000 miles of crude oil and water gathering pipe and over 11 million barrels of storage. Those figures combine crude and produced-water gathering and are stated for the joint venture as a whole, of which Energy Transfer holds 67.5% and Sunoco 32.5%, so they are not an Energy Transfer net measure and cannot be compared like-for-like with a crude-only mileage figure.
Effective July 1, 2024, Energy Transfer and Sunoco LP formed ET-S Permian, a joint venture combining their respective crude oil and produced water gathering assets in the Permian Basin. […] Energy Transfer contributed its Permian crude oil and produced water gathering assets and operations to ET-S Permian. Sunoco LP contributed all of its Permian crude oil gathering assets and operations to ET-S Permian. Energy Transfer’s long-haul crude pipeline network that provides transportation of crude oil out of the Permian Basin to Nederland, Houston and Cushing is excluded from ET-S Permian.
ET-S Permian operates more than 5,000 miles of crude oil and water gathering pipelines with crude oil storage capacity in excess of 11 million barrels.
p. 348 · Read in context →
Prepared remarks from Energy Transfer's FY2025 third-quarter call describing two projects that would pull Canadian barrels into the Mid-Continent-to-Gulf corridor where PAA's Capline, Diamond and Patoka and St. James terminals sit. The Southern Illinois Connector is contracted — 100,000 barrels per day from an open season completed with Enbridge, connecting near Wood River to Energy Transfer's Patoka assets — and has taken FID. The larger item, roughly 250,000 barrels per day of Canadian crude through Dakota Access, had not: management says it expects to take FID by mid-2026, so it is a stated intention rather than a commitment. The framing is Energy Transfer's own — "much needed capacity for oil out of Canada" — and the commercial motive management gives is filling spare capacity on its existing Dakota Access and ETCOP lines rather than adding new pipe.
Thomas Long (Co-Chief Executive Officer, Energy Transfer): In September, Energy Transfer, along with Enbridge, completed a successful open season for the Southern Illinois Connector project, which resulted in 100,000 barrels per day of contracts for transportation of Canadian crude oil to Nederland from both Flanagan and Hardisty. This project will connect Enbridge's pipeline near Wood River to Energy Transfer's assets in Patoka, Illinois to support the delivery of Canadian crude oil to the U.S. refineries, further strengthening market connectivity and value for all our stakeholders. […] Separately, Energy Transfer is working with Enbridge to provide capacity for approximately 250,000 barrels per day of Canadian crude oil through our Dakota Access pipeline. This project would provide much needed capacity for oil out of Canada and would be a significant part of the steady volume throughput on Dakota Access for many years to come. We have taken FID on the Southern Illinois Connector project and expect to take FID on the other project by mid-2026. We are very excited about both projects, which would fill available and additional capacity on our Dakota Access and ETCOP pipelines, and we look forward to providing additional details in the future.
p. 3 · Read in context →
Enterprise Products Partners L.P. (EPD)
The competitor whose crude pipelines run the same Permian-to-Gulf-Coast lanes as PAA's and who, in places, owns the other end of the same asset: Enterprise holds a 13% undivided interest in the Basin Pipeline, in which PAA reports an 87% interest. Its Midland-to-ECHO system, West Texas System, Seaway and Eagle Ford lines total 5,650 miles and 30.7 MMBbls of storage, and its crude marketing arm competes with PAA's supply and logistics business for wellhead barrels. In January 2026 it converted part of the Seminole NGL pipeline to crude service, adding Permian-to-Gulf-Coast crude capacity of exactly the kind PAA cites as a source of tariff pressure. Exhibits cover the crude segment only; the NGL, LPG export and petrochemical discussion that dominates Enterprise is excluded.
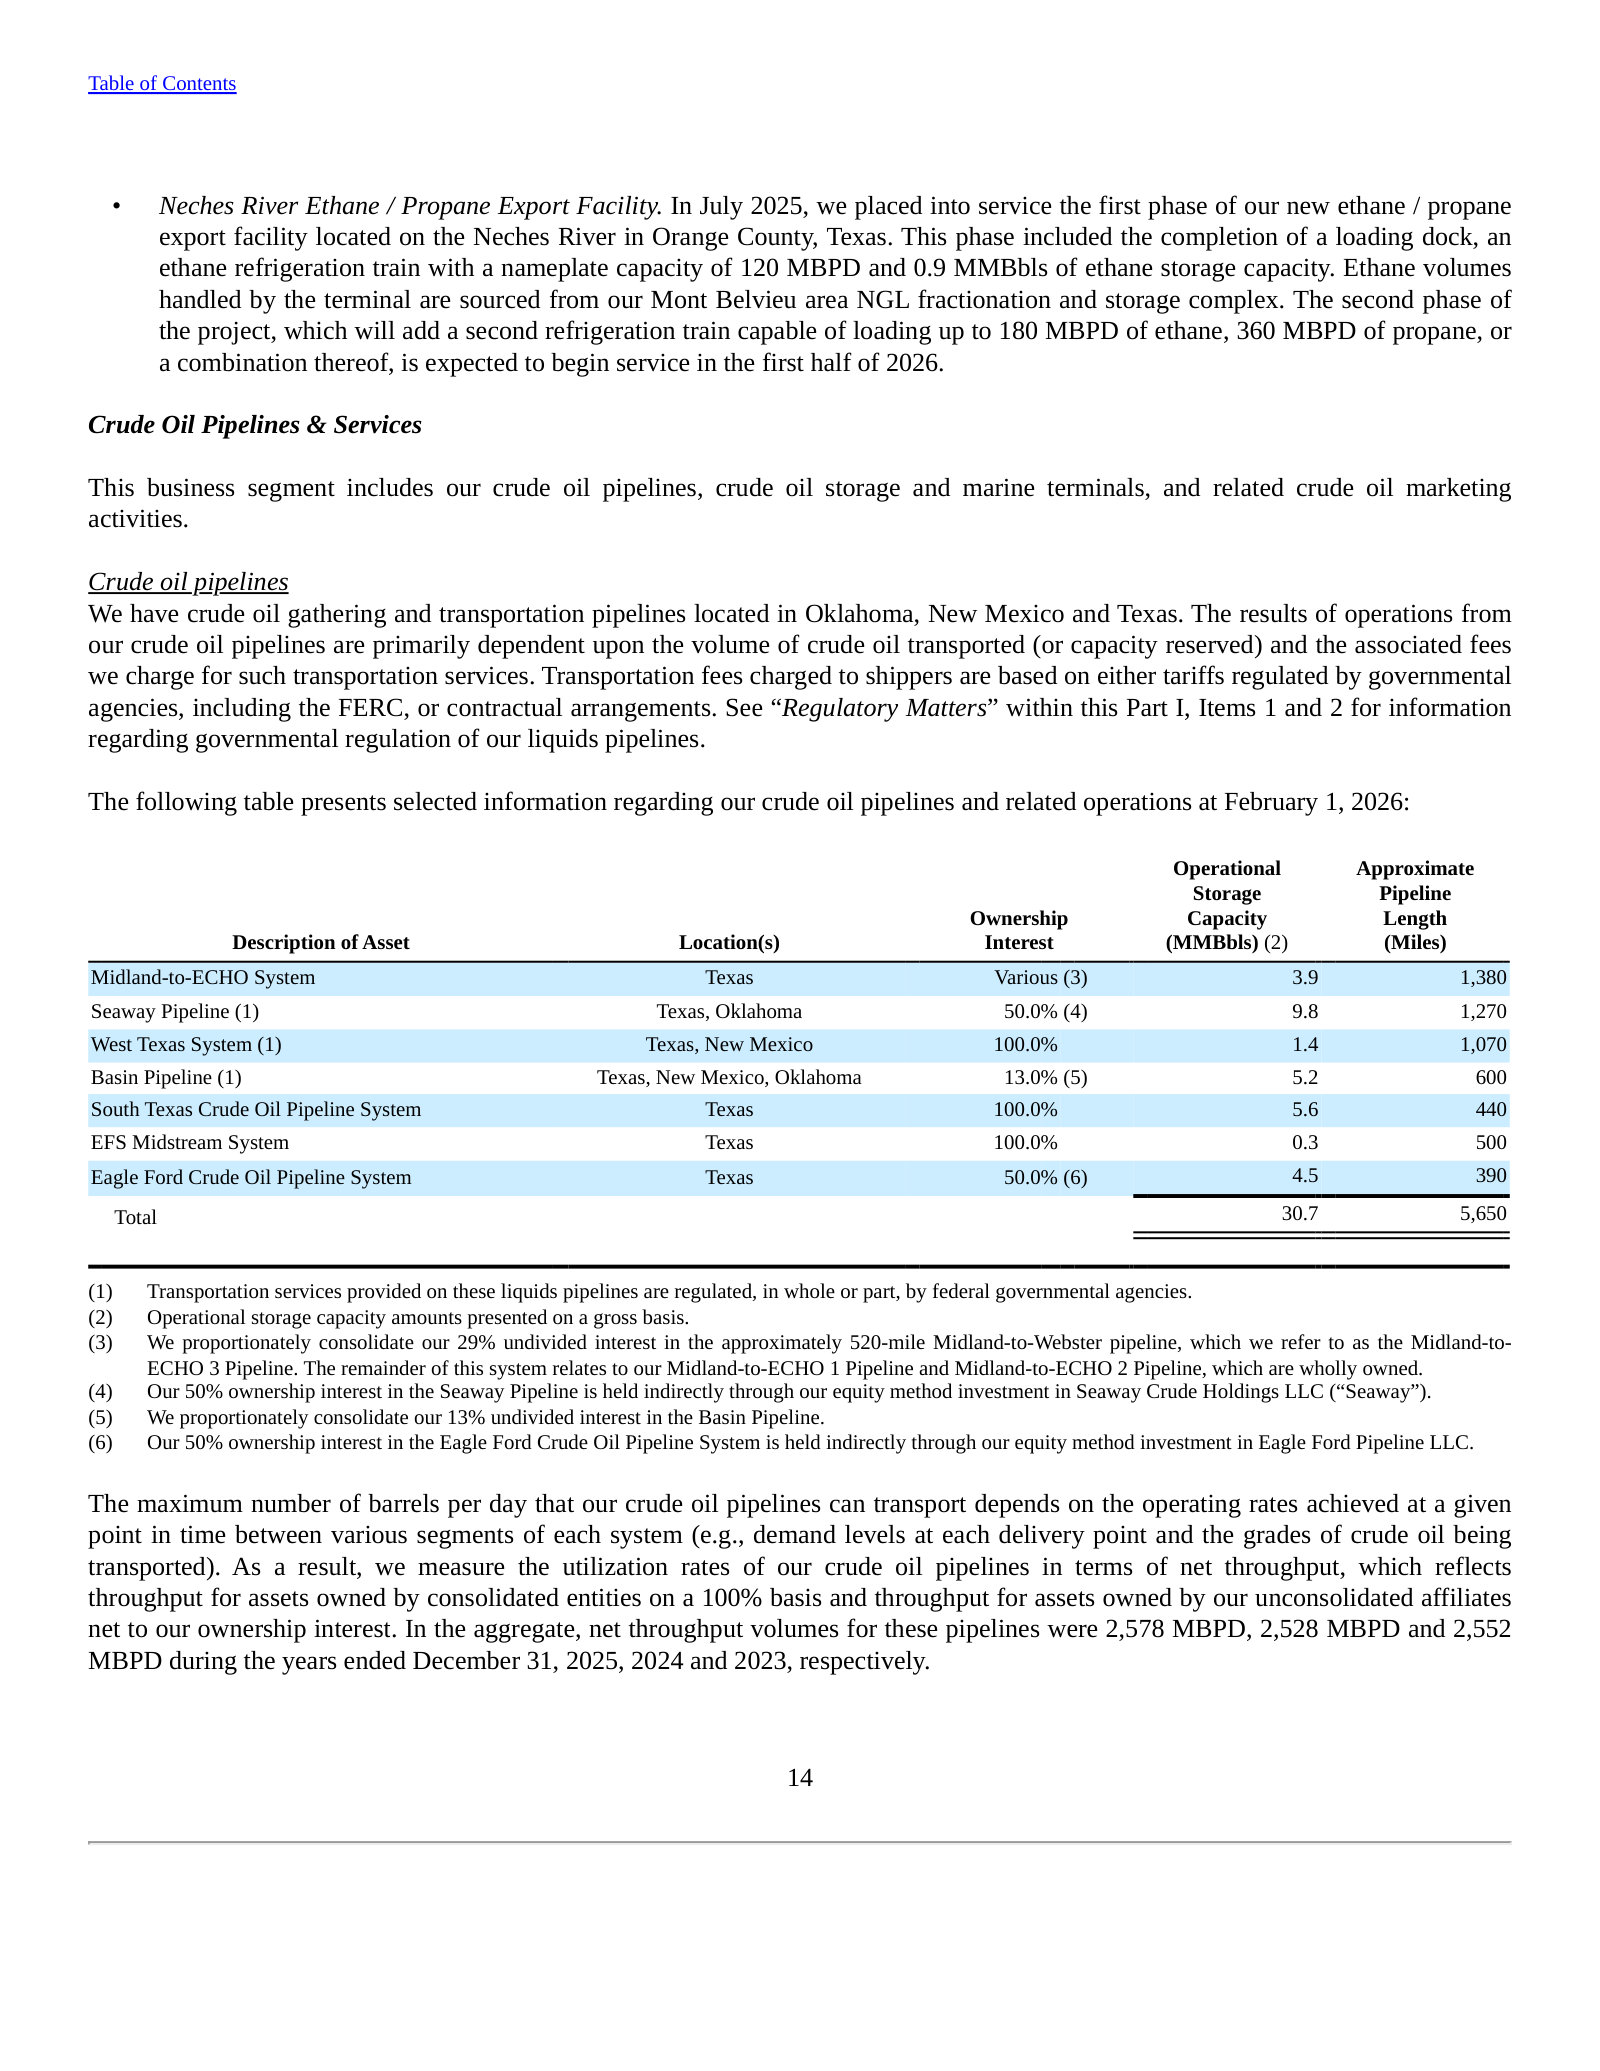
An analyst putting the recontracting question directly to Enterprise about its main Permian long-haul crude system, and the answer. Management says the first Midland-to-ECHO contracts roll off in 2028, that roughly 20% of the book rolls that year, and that it has already been filling and blending-and-extending capacity in advance. No rate, term or renewal spread is disclosed, so the exhibit sizes the exposure without pricing it. It is the closest public marker in this set for a risk PAA names in its own filings — heightened competition for uncommitted barrels and contract renewals on long-haul Permian pipelines, and the downward pressure that puts on tariffs. The transcript contains minor transcription errors ("roll of in '28") that are reproduced as indexed.
Jean Ann Salisbury (Analyst, Bank of America) and Jay Bainey (Executive, Enterprise Products): And I guess as a follow-up, do most of the Midland to ECHO crude pipeline contracts roll off in 2028 to 2029? I know that there have been some discussion o blending and extending, so not sure if that should kind of be later at this point. […] Jean Ann, this is Jay Bainey. So for '28, we have our first contracts roll off. But over the really, the course of last year and the year prior, you know, we have done, not only new contracts to fill that space, but blend and extend. So it's roughly about 20% that roll of in '28, but we'll be working on that this year or next.
p. 5 · Read in context →
Enterprise's co-CEO positioning its storage hubs on the FY2025 fourth-quarter call. Three of the four hubs he names — Cushing, Midland and Houston — are hubs where PAA also operates large crude terminals, and the "14 million barrels per day of oil equivalent" and "50,000-mile" figures are company-wide across all products, not crude. The pointed part is the last sentence: "open access systems where our customers can trade freely without any concern of being held hostage" is a competitive claim aimed at midstream operators whose marketing arms trade alongside their terminals, which is a fair description of PAA's integrated supply-and-logistics model. Enterprise runs a large crude marketing business of its own, so the distinction being drawn is about terminal access terms rather than about abstaining from merchant activity; no access terms or tariffs are cited to support it.
Jim Teague (Co-Chief Executive Officer, Enterprise Products): In total, we move over 14 million barrels per day of oil equivalent to our 50,000-mile pipeline network. Additionally, Enterprise looks at its storage hubs as a critical part of its infrastructure to support its customers. Cushing, Midland, Houston, and Mont Belvieu. These are all open access systems where our customers can trade freely without any concern of being held hostage.
p. 1 · Read in context →
MPLX LP (MPLX)
A crude logistics competitor of comparable pipeline scale to PAA but built on the opposite commercial foundation. MPLX runs 14,853 miles of crude and products pipelines and 88 terminals, and is expanding crude gathering in the Permian and Bakken — both PAA basins — while roughly two-thirds owned by Marathon Petroleum, which underwrites it with minimum volume commitments. That contrast is the reason to read it: PAA competes for uncommitted third-party barrels, MPLX begins each year with a captive refiner behind its crude tariffs. Exhibits are confined to the Crude Oil and Products Logistics segment; the Natural Gas and NGL Services segment — Northwind, BANGL, Marcellus processing, Gulf Coast fractionation — is out of scope for a crude pure-play comparison.
MPLX's own definition and sizing of the segment that competes with Plains, from its FY2025 Form 10-K: 14,853 miles of wholly and jointly owned pipelines, refining logistics at 13 refineries, 88 terminals, one export terminal, storage caverns, tank farms, an inland marine business and fuels distribution. The mileage is a combined crude-and-products figure on a gross basis including jointly owned lines, so it is not comparable to a crude-only or net-interest count. The closing sentence is the one that distinguishes this business from PAA's: the assets are described as "integral to the success of MPC's operations," with third parties named second. "jointlyowned" appears as indexed.
The Crude Oil and Products Logistics segment includes the gathering, transportation, storage and distribution of crude oil, refined products, other hydrocarbon-based products and renewables. These assets consist of a network of 14,853 miles of wholly and jointlyowned pipelines and associated storage assets, refining logistics assets at 13 refineries, 88 terminals including rail and truck racks, one export terminal, storage caverns, tank farm assets, an inland marine business and a fuels distribution business. For information related to our Crude Oil and Products Logistics assets, please see Item 2. Properties – Crude Oil and Products Logistics. Our Crude Oil and Products Logistics assets are integral to the success of MPC’s operations. We continue to evaluate projects and opportunities that will further enhance our existing operations and provide valuable services to MPC and third parties.
p. 15 · Read in context →
The sponsor relationship spelled out in MPLX's FY2025 Form 10-K — MPC held roughly 64% of MPLX's common units at year-end and takes service under long-term fee-based agreements that "include minimum committed volumes." The same page's table sets MPC's minimum commitment on crude pipelines at 1,933 mbpd under agreements with four- to ten-year initial terms. For a Plains reader the point is structural rather than promotional: a competitor of similar pipeline scale carries a contracted floor under its crude volumes that PAA, whose largest customer is a third party, does not. MPLX's belief that MPC "will promote and support" its strategies is the partnership's own characterisation, not a contractual right. The passage also names the Permian-to-Gulf-Coast value chain as the organising idea behind its recent acquisitions.
One of our competitive strengths is our strategic relationship with MPC, which operates one of the largest refining systems in the United States in terms of refining capacity. MPC owns and operates 13 refineries in the Gulf Coast, Mid-Continent and West Coast regions of the United States and distributes refined products, including renewable diesel, through transportation, storage, distribution and marketing services provided primarily by MPLX.
MPC retains a significant interest in us through its non-economic ownership of our general partner and held approximately 64 percent of the outstanding common units of MPLX as of December 31, 2025. Given MPC’s significant interest in us, we believe MPC will promote and support the successful execution of our business strategies. We have implemented and continue to pursue growth and integration opportunities along the existing product-based value chains that benefit both MPC and MPLX, demonstrated by the continued expansion of the Permian to Gulf Coast integrated value chain, which includes the recently completed Northwind Midstream Acquisition and BANGL Acquisition. […] Our Crude Oil and Products Logistics assets are strategically located within, and integral to, MPC’s operations. We have entered into multiple transportation, terminal and storage services agreements with MPC. Under these long-term, fee-based agreements, we provide transportation, terminal and storage services to MPC and most of these agreements include minimum committed volumes from MPC.
p. 16 · Read in context →
MPLX's stated crude-segment growth agenda, from prepared remarks on the FY2025 second-quarter call. Two of the items land directly on PAA: expanding crude gathering in the Permian and the Bakken, where PAA operates its Permian joint venture and its Rockies and Bakken systems, and "developing new market outlets" for those barrels. No capital figure, mileage or volume target is attached to the crude line here — MPLX has said separately that over 90% of its growth capital goes to the natural gas and NGL segment — so this reads as a statement of direction rather than a sized programme.
Maryann T. Mannen (President and CEO, MPLX): In our crude oil and products logistics segment, we are expanding crude gathering infrastructure in the Permian and Bakken basins, advancing butane blending initiatives at our product terminals, developing new market outlets, driving organic volume growth through our integrated network and pursuing other high-return projects aimed at maximizing the utilization of our assets.
p. 1 · Read in context →
Western Midstream Partners, LP (WES)
The peer that sits immediately upstream of Plains rather than across from it. Western Midstream gathers crude in the Delaware and DJ Basins and South Texas and hands it to long-haul carriers — PAA among them, by name, in its own Form 10-K — while stating publicly that it does not compete in long-haul pipelines at all. That makes it two things at once: a source of barrels for PAA's lines and a rival for the wellhead dedications that determine whose lines those barrels reach. It is also a former partner in assets PAA now consolidates, having sold its 15% interest in Cactus II in 2022. Exhibits are limited to the crude oil gathering business; the natural gas processing and produced-water discussion that drives most of WES's earnings is out of scope.
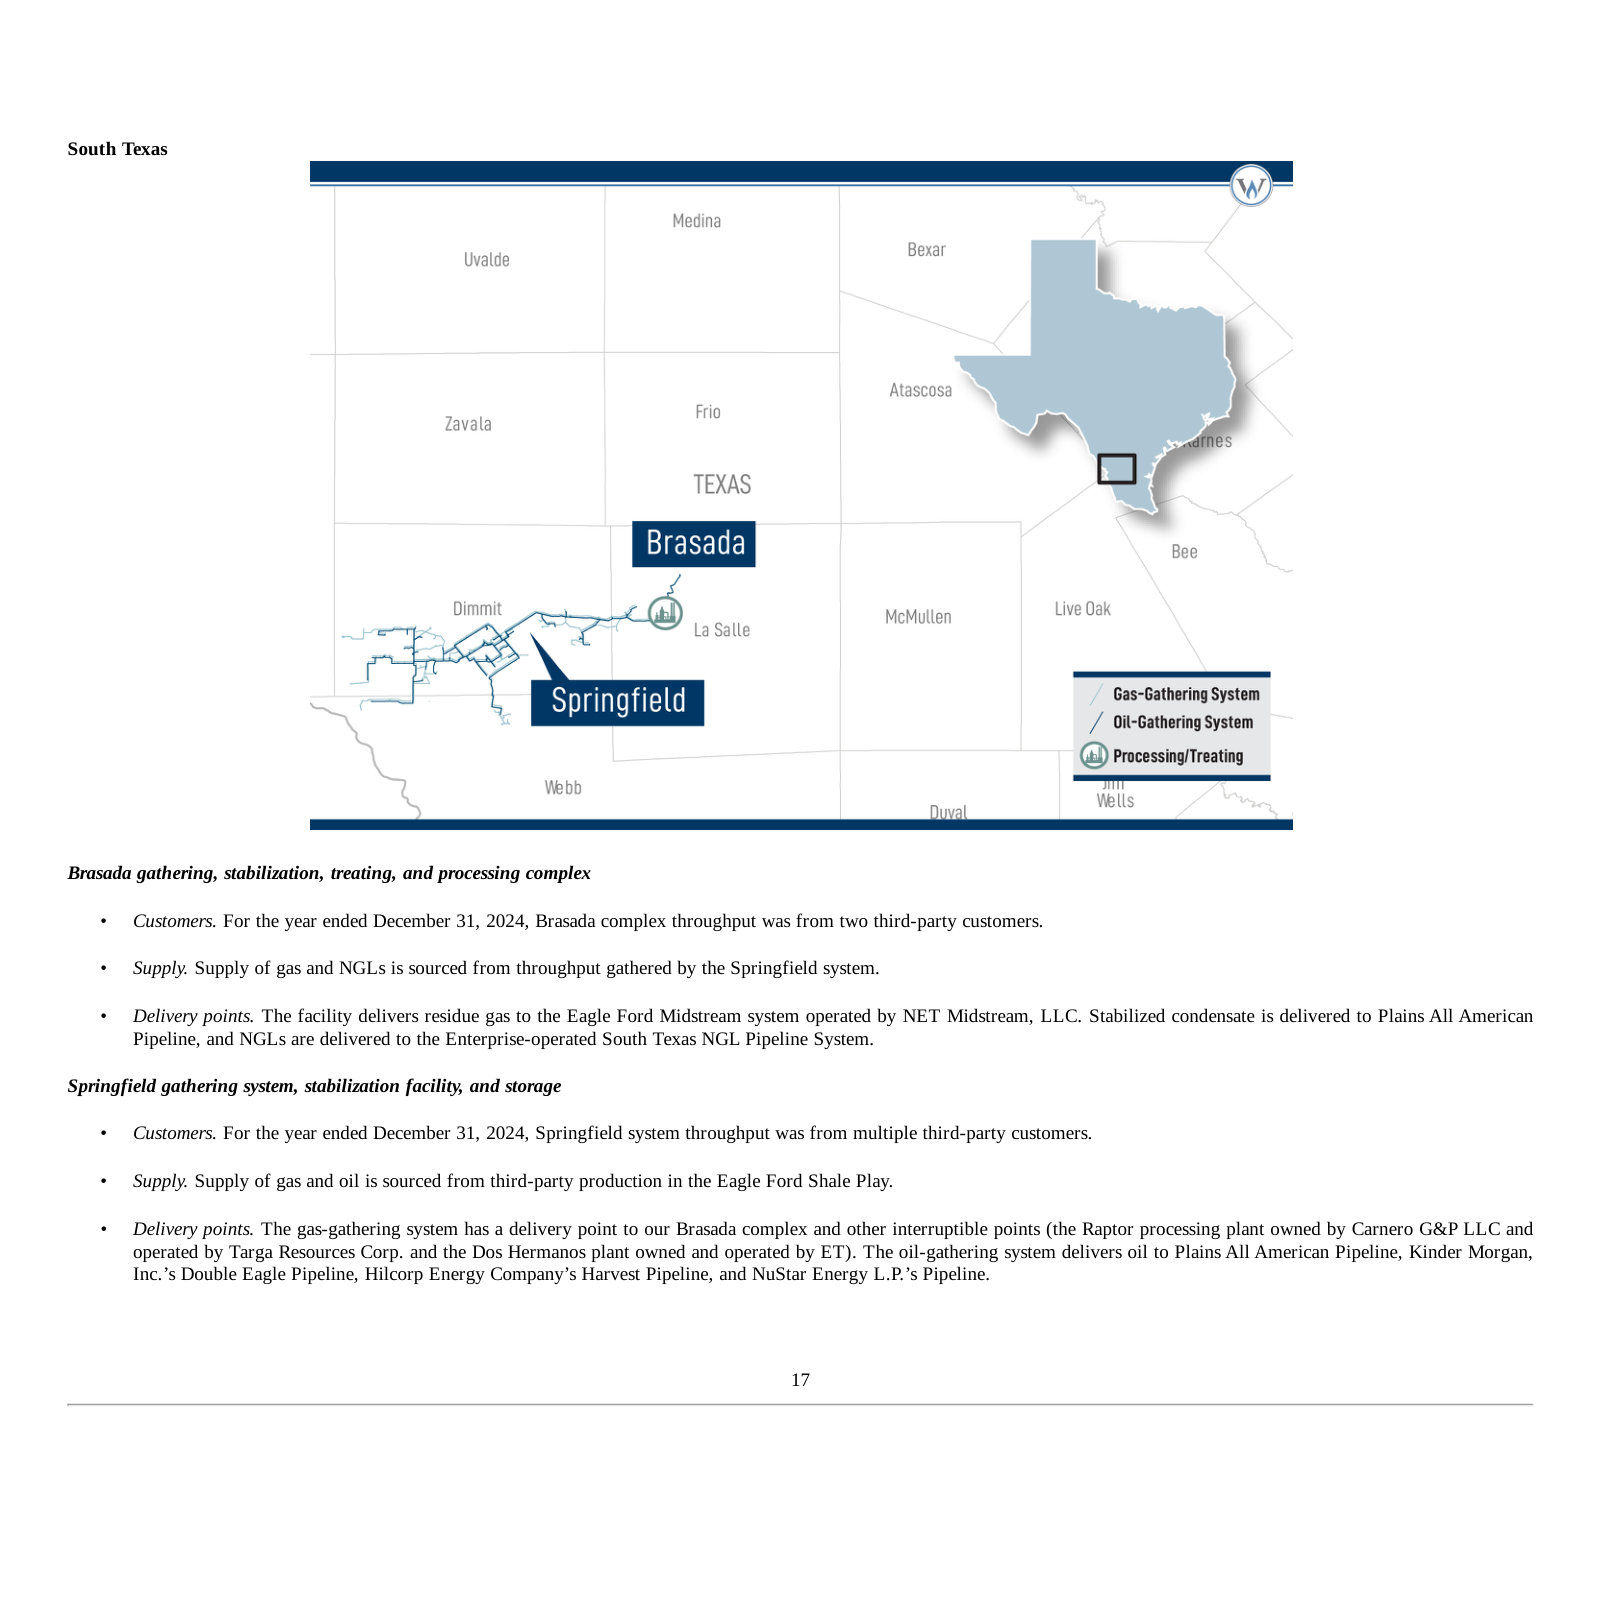
Western Midstream's CEO answering a direct question about midstream consolidation and whether WES needs to be bigger, on the FY2025 fourth-quarter call. The answer draws an explicit boundary: "Where we are limited, we don't compete. We are a gathering and processing company, so we aren't involved in long-haul pipeline activities." That is a competitor voluntarily ceding the segment PAA occupies and explains why WES's own filings list PAA as an outlet rather than a rival. Two claims are the company's own and unaudited: that it is "ten times the size of our next significant competitor" in produced water, which depends entirely on how that market is defined and is not sourced here, and that scale matters "across all the markets we operate in." The project sizes he gives — $200 million to $300 million — describe gathering systems, compression and processing plants, not pipelines.
Jeremy Tonet (Analyst, JPMorgan) and Oscar Brown (Chief Executive Officer, Western Midstream): I'm curious about your thoughts on how WES compares, especially since many competitors have grown significantly. Would it be beneficial for WES to expand further in order to compete more effectively with these larger entities, or do you believe that your current size is sufficient? […] I believe we are at a good size, but we can always grow. With the consolidation among our customers and within the midstream sector, scale will continue to be important. One reason we will remain a leader in the water business is that we are ten times the size of our next significant competitor in this sector, which allows us to tackle projects that would challenge their capabilities. This principle applies across all the markets we operate in. Scale is certainly important, but we don't intend to get larger for the sake of it; we will continue to execute our growth strategy. Where we are limited, we don't compete. We are a gathering and processing company, so we aren't involved in long-haul pipeline activities. The types of projects that fit our expertise—like gathering systems, new compression facilities, gas processing plants, and potentially expanding into CO2 solutions— are all manageable at our current size.
p. 9 · Read in context →
Genesis Energy, L.P. (GEL)
The smallest peer here and the one that competes with Plains on a different axis: supply source and transport mode rather than basin. Genesis moves deepwater Gulf crude to onshore Texas and Louisiana refining centres on the CHOPS and Poseidon systems, then handles, blends and stores it at its own onshore terminals — the Gulf Coast market PAA's St. James, Patoka and Gulf Coast terminals serve — and separately runs a Jones Act marine fleet, which is one of the alternative transport modes PAA names as competition in its own filings. It also carries PAA in its executive compensation peer group. Exhibits are confined to offshore crude pipeline transportation and its onshore extension; the soda ash and sulfur services businesses, which have nothing to do with PAA, are excluded.
Genesis sizing its own market and its position in it, in the FY2025 Form 10-K. The market claim is that the Gulf of America accounted for approximately 14% of U.S. crude oil production in 2025 — a supply pool that reaches Gulf Coast refineries and export docks in competition with the Permian barrels PAA moves. The position claim is 1,536 miles of operating offshore crude pipe with roughly 2,094 MBbls per day of aggregate design capacity, and 64% interests in CHOPS and Poseidon, described as "two of the largest crude oil pipelines (in terms of both length and design capacity) located in the Gulf of America." Design capacity is a nameplate figure, not throughput, and the mileage and capacity are stated for systems in which Genesis holds partial interests, so neither is a net-to-Genesis measure.
The Gulf of America is one of the most active drilling and development regions in the U.S. representing approximately 14% of the crude oil production in the U.S. during 2025. […] Our interests in offshore crude oil pipeline systems that are currently operating (a number of which pipeline systems are substantial and/or strategically located) include approximately 1,536 miles of pipe with an aggregate design capacity of approximately 2,094 MMbls/day. For example, we own a 64% interest in the CHOPS Pipeline and a 64% interest in the Poseidon Pipeline, which are two of the largest crude oil pipelines (in terms of both length and design capacity) located in the Gulf of America.
p. 13 · Read in context →
Genesis management's reserve-replacement arithmetic for its offshore system and its claim to a unique position in the region, from the FY2025 third-quarter call. On the preceding page of the same call, management put expected throughput at roughly 750,000 barrels per day once Shenandoah and Salamanca ramp, or about 275 million barrels a year; here it argues that at an assumed 25 million barrels of ultimate recovery per deepwater well, about eleven new wells a year tied back to connected platforms would hold that throughput flat with no further capital. Both inputs are management's assumptions, the recovery figure is described as conservative but is not sourced, and the drilling is done by third-party producers, not Genesis. The positioning claim — "the only truly independent third-party provider of crude oil pipeline logistics in the region" — turns on reading "independent" as unaffiliated with a producer or refiner; several other operators own offshore Gulf crude pipelines.
Grant Sims (Chief Executive Officer, Genesis Energy): At a conservative average economic ultimate recovery of 25 million barrels of oil per deepwater well, we need to have the producing community drill, complete and tie back to FPUs currently connected to our infrastructure, only 11 or so wells per year to, in essence, fully replace the reserves produced and transported through our pipelines in any one year. This, in turn, simply extends or annuitizes our ability to produce these anticipated 2026 type run rate financial results from our offshore segment for many years, if not decades in the future without having to spend any money. […] We continue to engage in robust commercial discussions with producers across the Central Gulf of America, and we believe Genesis is uniquely positioned as the only truly independent third-party provider of crude oil pipeline logistics in the region, setting the stage for continued growth in decades and decades of opportunities out of this world-class basin.
p. 3 · Read in context →
More peer documents
ONEOK — Q4 FY2025 earnings call — Q4 FY2025 · 14 pages · Page 4 states that ONEOK expects increased throughput into its long-haul crude pipelines from its own gathering systems as interconnectivity expands, with further synergy projects landing in 2026 and 2027 — the multi-year version of the barrel-steering exhibit. · Open →
Western Midstream — FY2025 Form 10-K — FY2025 · 221 pages · Page 31 describes White Cliffs, in which WES holds 10% and PAA also holds an interest, delivering Rockies crude from Platteville to Cushing; pages 74 and 129 detail the 2024 exits from Saddlehorn and Whitethorn, two more assets PAA is connected to. · Open →
Enterprise Products Partners — Q2 FY2025 earnings call — Q2 FY2025 · 9 pages · Page 1 is Jim Teague on export-market overbuild — spot terminal fees down about 60% year on year and a legacy double-digit-fee contract recontracted at market — with a stated intention to "aggressively defend our position" using brownfield economics. The clearest peer account of what recontracting into an overbuilt market costs. · Open →
MPLX — Q1 FY2026 earnings call — Q1 FY2026 · 6 pages · Page 3 covers the Gulf Coast crude picture from a refinery-connected operator: Mount Airy running harder next to Garyville, Venezuelan barrels arriving through LOOP, and imports and exports both rising across that asset base. · Open →
Fit — Plains GP Holdings (PAGP)
Outside the framework's universe (U2 not met); contested: P2
Outside the framework's universe. PAGP fails the market-cap universe test, so the framework does not reach the pillars: the listed Class A equity is worth $5.21B on the 197,904,124 shares outstanding, or $6.13B on the fully-exchanged basis, against a $10B floor [1]. The confidence tier is high: two model families agreed, the trial was order-stable, and load-bearing spreads were at most 0.15. No exclusion fired and the name-mask probe raised no prior-driven risk. One pillar is contested — P2, FCF consistency, which cannot be tested on the framework's own adjusted-FCF basis.
The verdict here is the deterministic tally's; this tab renders it and cannot soften or extend it.
Universe and exclusions — unsoftened
Here is the decisive point. What trades under the ticker PAGP is not the pipeline. It is a holding vehicle whose listed Class A equity is worth far less than $10B, and that alone puts the company outside the universe the framework will consider.
The arithmetic: 197,904,124 Class A shares were outstanding at 20 February 2026 [2]; at the $26.33 close on 31 July 2026 that is $5.21B, 52% of the line. On the wider, fully-exchanged basis — AAP's approximately 233.0 million PAA common units, the count once the Legacy Owners' stapled interests convert one-for-one — the value is $6.13B, 61% of the line, still $3.87B short [3]. The feature file could not compute market cap ("no positive annual period-end or outstanding share count"), so this is built from the filed share count and the dated close, not from the feature.
The counter-fact sits in the same breath, and it is a large one: the underlying operating partnership clears the line comfortably. PAA's common units were worth $17.33B on 31 July 2026, and PAGP consolidates $31.3B of assets and $10.93B of net debt against $2,809M of LTM Adjusted EBITDA attributable to PAA [4]. The enterprise is large and essential. The listed instrument a Class A buyer actually owns is not, and the framework's universe line is drawn on the listed instrument.
U1 — geography — is met. PAGP is a Delaware limited partnership, primary-listed on the Nasdaq Global Select Market as symbol PAGP; it is not an ADR and has no Chinese connection [5]. One qualifier belongs on the record: what lists is a partner interest in a wrapper that owns no operating assets and draws all its cash from an indirect limited partner interest in PAA [6], and because PAGP elected corporate tax treatment it issues a Form 1099 rather than a Schedule K-1 [7].
No hard exclusion fired. Each was checked against the record:
- Car company (X1): not an auto manufacturer — crude midstream and merchant logistics across 20,405 system miles, zero automotive revenue.
- Promotional CEO (X2): not triggered — across a five-promise sample from 2022 to 2025 management kept its leverage, cost-programme and distribution-cadence commitments while missing two (its Permian volume forecast and its own narrowed FY2025 EBITDA range), and officers and directors own roughly 57.8 million units worth about $1.3B with hedging and pledging prohibited [8].
- Structural decline (X3): not present — the three-year high-single-digit revenue-decline disqualifier is false (longest run is two years), and the fee/services line rose 49% since FY2016.
- Consensus darling (X4): not triggered on valuation — PAA trades at 0.39x sales, the cheapest in its own disclosed peer group, on a split analyst book with a mean target below the market. The counter-fact: the total-return chart has run bottom-left-to-top-right for five years — the Class A index reached 327.17 against 195.98 for the S and P 500 over 2021–2025 — so the entry point is not fear either [9].
- China (S1): zero — FY2025 revenue and long-lived assets are entirely US and Canada; the single "China" reference in the 10-K is a risk factor naming it as a global consumption market [10].
Pattern match
Of the framework's four setups, PAGP most resembles the second — high dividend yield plus high FCF yield, business not going away. It carries a 6.34% distribution yield on a business that is not disappearing. But the pattern's own checks do not clear: the yield case in that setup turns on a high FCF yield and on the distribution never having been cut, and here the adjusted look-through FCF yield is 4.67% (below every bar), while PAA cut its distribution 48% in the 2020 downturn, from $1.38 to $0.72 per unit [11]. It is not a cyclical-bank bottom, not a healthcare forecasting error, and not a tech monopoly on a fear dip. As an actionable setup it fits none of the four patterns — and in any case the universe gate has already closed the question.
The pillar ledger
The gate rule applied is U2 not_met → out_of_universe; the pillars below were still adjudicated by the jury and are recorded for completeness. Reference lines, not grades.
Source: deterministic fit tally (ruchir/fit_tally.json); per-criterion evidence in the pillar treatments below.
Year-10 gate (P1) — not met
The gate is binary by construction, and any proper doubt fails it. It fails on both legs. Roughly 96% of FY2025 revenue ($42,408M of $44,262M) is crude bought and resold at the prevailing WTI price, so "year-10 revenue higher" is a commodity-price forecast, not an earning-power judgement [12]. On the cash leg, Crude Oil Segment Adjusted EBITDA per tariff barrel has fallen from $1.140 (FY2019) to $0.663 (FY2025) — a 42% compression — even as tariff volumes rose 46%; the company's own Item 1 has disclosed for five straight years that Permian overbuild "puts downward pressure on tariffs and margins," and Q1 FY2026 confirmed certain long-haul rates reset to market in 2025 [13]. This is a contested oligopoly of six named competitors, not a monopoly or duopoly — the P1 probability sits at 0.5 with a 0.13 spread.
The strongest surviving counter-fact, in the same treatment: segment Adjusted EBITDA has still risen every year, from $1,909M (FY2021) to $2,344M (FY2025), guided to $2,640M–$2,700M for FY2026, and the contracted book is 76% larger than at end-2021 ($3,430M versus $1,949M of remaining performance obligations) [14] [15]. Volume growth and acquisitions have outrun the per-barrel compression so far. "So far," at the very-high-conviction bar the gate demands, is not enough. Full treatment: Durability.
FCF consistency (P2) — contested
This is the contested pillar. The two Claude jurors read it met; the two Codex jurors returned cannot determine — a split across families that the tally records as contested. The reason is a data limitation, not a disagreement about the business: the framework's rolling five-year average adjusted FCF cannot be computed here, because fit_features.fcf_stability returns an empty series and fit_features.adjusted_fcf carries stock-based compensation as null for every year FY2016–FY2025 and treats acquisitions as an implicit zero [16].
On reported FCF the rolling five-year average rose in every window, from $783M (FY2016–2020) to $2,048M (FY2021–2025), with one negative year, FY2016, driven by a growth-capex build rather than an operating loss. But the framework's adjusted basis would deduct the acquisition spend the feature omits — $2,651M in FY2025 alone and over $5.7B cumulatively since 2016 — which takes a large bite out of that reported series [17]. The pillar is contested because the test as constructed cannot be run, not because the answer is known and disputed. Full treatment: Durability.
Dislocation and yield (P3) — the entry trigger does not stand today
A real dislocation happened: the shares fell 23.9% from $22.13 (30 Jan 2025) to $16.85 (10 Oct 2025), 83% of it in four sessions on the April 2025 tariff-and-OPEC+ crude shock — P3a is met. But three of the trigger's four conditions do not clear:
- P3b — no capitulation. Volume peaked at 1.59x the pre-peak median, and it peaked in the April event window nearly six months before the low; the 10 October trough itself printed on 0.86x median volume. Peak fear did not mark the bottom.
- P3c — adjusted yield far below the bar. FY2025 adjusted FCF of $1,537M falls to $865M after the preferred and joint-venture-minority claims that rank ahead of the common — $1.229 per look-through unit, a 4.67% yield at $26.33. The balance sheet is levered (net debt $10.93B / $2,833M Adjusted EBITDA attributable to PAA = 3.86x) [18], so the applicable reference line is 25%. The yield sits 2,033 basis points below it, and below the 10% default and 8–9% fortress lines as well.
- P3d — consensus does not clear the bar and there is nothing to mean-revert. Capital IQ consensus free cash flow of $1,580M (FY2026) rising to $2,043M (FY2029) is 4.97%–7.46% on a look-through basis. Consensus is rising, guidance was raised to $2,880M in May 2026, and the price already sits above its pre-drawdown peak [19] — the usual "buy the cut, underwrite the reversion" argument is unavailable because there is no cut to reverse.
The counter-fact worth carrying: the FY2025 5-year acquisition average is inflated by a single year; on the pre-2025 run rate the FY2025 yield is 7.30% rather than 4.67% — a 263 bps improvement that still leaves 1,770 bps to the levered bar. Full treatment: Yield and Dislocation.
Balance sheet and self-help (P4) — the flywheel does not run
The point of the framework's dislocation is a buyback flywheel, and it is absent here. Cash spent on common repurchases was $8M across FY2023–FY2025 combined, against $2,709M of common distributions over the same years; $190M of a November-2020 authorisation sits unused; and the unit count has risen 1.07% over three years on roughly $50M a year of equity-indexed compensation with no repurchase offset — the framework's rising-share-count condition (P4b, not met). Capital allocation is explicitly sequenced with debt paydown first and repurchases fourth of four, gated on leverage reaching the bottom of the 3.25x–3.75x range (P4a, not met) [20]. At today's price, retiring the entire common float out of adjusted FCF takes 12.1 years, or 21.3 years of the FCF that actually reaches common holders — against the framework's absurdity marker of roughly three.
The counter-facts, fairly stated: the acquisitions were funded with debt and divestiture proceeds, not equity — the 10-K states the company does not plan to issue common equity to fund spending [21] — the unit count is still ~21M below its 2020 level, and prices paid on the units it did buy ($8.03 and $9.86) were well below today's $26.33. And the balance sheet can plainly outlast the problem: investment-grade, $2.0B of liquidity, no senior-note maturity in 2027 or 2028, and $3.3B of NGL-sale cash received in May 2026. The debt paydown is transitional. But willingness to repurchase at the moment of maximum yield — the mechanism the framework needs — is not on the stated plan. Dividend safety (P4c) is 160% covered on the company's own distributable-cash-flow measure yet only 0.82x on adjusted FCF available to common, and the payout was cut roughly in half in 2020 [22]. Full treatment: Self-Help.
Diagnosis (P5) — met; the damage was temporary
The adversarial trial — two opposing cited briefs, three blind judges — ruled the impairment temporary with probability 0.71 (per-judge 0.71 / 0.68 / 0.78; order-stable, gap 0.02). The one durable drag — Permian long-haul recontracting — is a bounded ~$235M/year step that management's own 2025→2026 bridge more than offsets with $250M of Cactus III EBITDA, $50M of efficiency and $50M of optimization, so net run-rate EBITDA rose from $2,833M to $2,880M [23]. P5 being met does not rescue the case: it establishes that the 2025 fall was a re-rating rather than a permanent impairment, but the re-rating has already been paid back — at the trough the price fell about $1.04B against a plausible permanent NPV hit near $0.66B, and at $26.33 that gap is closed. The strongest counter-fact the trial preserved: the self-correction relied on $2.9B of acquisition capital, and the 10-K's "overbuild" language is genuine evidence that a further recontracting drag could recur. Full treatment: Damage Math.
Instrument context (I1) — not verifiable from the corpus
Facts only, and unverifiable here: listed PAGP options run out to 21 January 2028 (17.6 months from 3 August 2026) with 17,294 contracts of open interest, and 30-day implied volatility was 19.68% on 31 July 2026 — well below the framework's ~50–55 reference line, but the longest expiry falls 0.4 months short of the 18-plus months the framework prefers, and daily turnover in that January 2028 line is thin. The evidence is web-only (a published option chain and volatility statistics); the corpus holds no PDF page for either, so I1 is recorded as not verifiable. Full treatment: Clock.
What a 3x-in-3-years would require
The tally records the re-rating arithmetic as unavailable: "Re-rating math unavailable because the applicable bar or normalized adjusted FCF is missing." The feature file could not compute market cap, adjusted FCF, the yield baseline or the consensus forward yields, so the framework's standard bar-yield price cannot be struck from it.
The target test can still be stated as arithmetic from the surviving yield claims. To reach the 25% levered yield the balance sheet selects would take roughly $4.65B of adjusted FCF to the common — about five times FY2025 and more than PAGP's entire consolidated Adjusted EBITDA. To reach even the 10% default line takes about $1.86B to the common, roughly 58% above the FY2029 consensus mean, or a price near $12.30 — a 53% fall from here. The growth mechanism that would lift cash flow is already inside the rising consensus path, so the yield does not re-rate upward from a depressed base; there is no depressed base [24].
Base-rate context from this name's own history reinforces the point rather than softening it. Across twelve drawdowns of 20% or deeper since the 2013 listing, every round trip completed inside 24 months came from an episode shallower than 40%; the two genuinely deep recoveries took 26.5 and 82.6 months, and three deep episodes never regained their peak. The 2025 drawdown was a shallow 23.9% and behaved exactly to that base rate, recovering in 386 days. The deep capitulation the framework hunts has, in this name, always taken years — and it is not on offer today. See the episode set in Clock.
Contested and undetermined
Contested: one pillar, P2 (FCF consistency), split across model families — the two Claude seats read it met, the two Codex seats returned cannot-determine — because the framework's rolling five-year adjusted-FCF series is not computable from the feature file (stock-based compensation is null for every year FY2016–FY2025 and acquisitions are treated as an implicit zero). The reported-FCF series is stable and rising; the adjusted series the framework requires simply cannot be built here.
Undetermined (cannot-determine on the framework's basis): none of the gate criteria. The only not-verifiable item is I1, instrument context, where the option-chain and implied-volatility figures are web-only with no corpus page to cite.
Provenance
Source: deterministic tally provenance block (ruchir/fit_tally.json) and trial tally (ruchir/trial/tally.json).
Two model families sat the jury and agreed on every gate. The verdict was pressed hard: fifty claims were triaged, sixteen taken through the full skeptic protocol where the arithmetic is recomputed from cited pages, and only one weakened (a secondary sensitivity note on the consensus yield claim) while none were refuted; the single unverifiable item is the web-only option data. Because the out-of-universe result rests on a filed share count and a dated price rather than a modelled judgement, the confidence tier is high and the spread that matters most (P1 at 0.13, P5 at 0.10) never widened enough to put the gate in doubt.
The falsifier ledger — standing what-would-change-this conditions
The framework's template falsifiers, applied to this name:
- adjusted FCF or EBITDA declines where flat-or-better was underwritten
- revenue declines for a third consecutive year
- capital allocation pivots to debt paydown over repurchases
- share count inflects upward
- the industry repricing cycle fails to materialize where industry-wide mean reversion was underwritten
The name-specific falsifiers, with thresholds, directions and windows (verbatim, as recorded in the tally):
Data gaps
The run could not answer several things the framework normally computes:
fit_featurescould not compute market_cap, adjusted_fcf, adjusted_fcf_yield, yield_baseline, balance_sheet_class, fcf_stability, share_count_trend, float_retirement_years or the consensus forward yields — every one is flagged not_computable, with market cap failing on "no positive annual period-end or outstanding share count." The U2 arithmetic here is built from the filed Class A share count and the dated close, not the feature.- Stock-based compensation is null for every year FY2016–FY2025, and acquisitions are treated as an implicit zero, so no adjusted-FCF series or rolling five-year stability could be built from the feature file; the figures in this report are rebuilt from the filed cash-flow statements.
- The structured balance-sheet feed reports only $1,099M of long-term debt for FY2025 (the term-loan line), irreconcilable with the ~$10.7B debt stack in the footnote; the filed figure is used for the balance-sheet class.
- No PAGP annual report earlier than FY2021 is in the corpus, and the pre-2016 daily-price series is internally inconsistent (2013–2014 closes of $58–$85), so long-run absolute-dollar chart work is unreliable; base rates here are expressed as percentage depths and calendar durations, which are scale-invariant.
- Reported short interest is unavailable for PAGP (FINRA returned no rows), so any short-driven component of the 2025 selling is invisible; and the option-chain and implied-volatility figures are web-only, with no corpus page.
- PAGP-level per-share cash flow after the 12 May 2026 Keyera NGL-sale close is not yet in the corpus; the FY2025 10-K predates completion and the Q1 FY2026 10-Q still reports the Canadian NGL business as discontinued operations held for sale.
What Plains Is
Plains GP Holdings owns no assets. It is a Nasdaq-listed Delaware partnership whose only cash-generating holding is an indirect roughly 31% look-through claim on Plains All American Pipeline, the crude oil gathering, pipeline, storage and marketing system that moved 9.68 million barrels a day in 2025. On the framework's universe test the security misses: PAGP's Class A shares carry a market capitalization near $5.2 billion against the $10 billion line.
Plains GP Holdings, L.P. ("PAGP") is a Delaware limited partnership headquartered in Houston that has elected to be taxed as a corporation. It owns no operating assets. Its sole source of cash flow is an indirect limited partner interest in Plains All American Pipeline, L.P. ("PAA", Nasdaq: PAA), held through an intermediate partnership, Plains AAP, L.P. ("AAP") [1]. At 31 December 2025 PAGP held approximately 197.9 million AAP units, an approximate 85% limited partner interest in AAP; AAP in turn owned approximately 233.0 million PAA common units, approximately 31% of PAA's outstanding common and Series A preferred units combined [2]. The remaining approximately 15% of AAP is held by the "Legacy Owners", whose stapled interests exchange one-for-one into PAGP Class A shares [3].
Two features of the wrapper matter before any operating analysis. First, PAGP is a pass-through on PAA's distributions and nothing else — it consolidates PAA for accounting purposes but its economics are a fractional claim on PAA's distributable cash. Second, because PAGP elected corporate tax status, holders receive a Form 1099 rather than the Schedule K-1 a direct PAA unitholder receives [4]. That is the whole reason the two securities trade apart: on 31 July 2026 PAGP closed at $26.33 while PAA closed at $24.57, a 7.2% premium for the simpler tax form on an otherwise identical underlying claim.
PAA itself is old. It was formed in 1998 and has been publicly traded since that year [5] — 28 years of operating history. PAGP is the newer wrapper: it listed in October 2013 at $22.00 per Class A share [6], 12.8 years ago.
Universe Screen
Listing and instrument (U1) — clean. PAGP Class A shares representing limited partner interests are registered under Section 12(b) and listed on the Nasdaq Global Select Market under the symbol PAGP [7]. The registrant is a Delaware limited partnership with principal offices in Houston, Texas [7]. This is a US primary listing of a US company — not an ADR, not a foreign private issuer, not Chinese in any respect. ISIN US72651A2078. The only instrument nuance worth recording: what trades is a partnership interest in a holding vehicle, not common stock in an operating company.
Market capitalization (U2) — a miss, by roughly 40%. The deterministic feature file cannot
compute market cap for this run (fit_features.market_cap is null; the stated reason is "no
positive annual period-end or outstanding share count"), so the figure is built from the filed
share count and the dated close rather than taken from the feature. Two defensible bases, both
short of the line:
Share counts from the FY2025 Form 10-K: 197,904,124 Class A shares outstanding at 20 February 2026 [7], and 233.0 million PAA common units held by AAP, the fully-exchanged economic count [2]. Closing price from the run's daily price series; the fully-exchanged figure reconciles to a third-party market cap of $6.13B quoted for 31 July 2026.
The arithmetic: 197,904,124 × $26.33 = $5.21B, or 52% of the $10B line. On the wider basis that counts the Legacy Owners' exchangeable interests, 233.0M × $26.33 = $6.13B, 61% of the line — $3.87B short. There is no rounding at which this clears.
The strongest fact against reading that as decisive: the enterprise underneath is not small. PAA's own common units carry a $17.33B market capitalization (705.5 million units at $24.57 on 31 July 2026), PAGP consolidates $31.3 billion of total assets, and net debt at 31 March 2026 was $11.2 billion against last-twelve-months Adjusted EBITDA attributable to PAA of $2.81 billion [8]. The business clears $10 billion comfortably; the listed security Ruchir would own does not. The screen is written against the security.
Segments and Geography
Plains manages two operating segments, Crude Oil and NGL [9]. As of the FY2025 filing that is close to a one-segment company. In June 2025 a PAA subsidiary agreed to sell Plains Midstream Canada ULC — substantially all of the Canadian NGL business — to Keyera Corp. for approximately CAD 5.15 billion, roughly $3.75 billion, and the operations were reclassified to held-for-sale and discontinued operations [1]. That sale closed on 12 May 2026 [10]. What remains is a North American crude oil pure play with a small retained US NGL remnant.
How the money is made, in one line: Plains buys crude oil at the wellhead, moves it on its own and third-party pipelines to hubs, terminals and export docks, and sells it there — earning tariffs and terminalling fees on the assets and a margin on the barrels [11]. Crude oil is the feedstock for transportation fuels and heating oil, and its lack of fungibility across grades is precisely what creates the logistical work Plains is paid for [12].
That model has a reporting consequence a cold reader must absorb before looking at any growth rate. Of FY2025's $44.3 billion of revenue, $42.5 billion was product sales — the gross buy-and-resell value of physical barrels — against $1.8 billion of services revenue. Revenue is therefore mostly a commodity-price gross-up, and it moves with crude, not with the business.
Source: reported revenue per company filings, FY2016–FY2025; FY2025 total of $44,262 million is the sum of the geographic disclosure in the FY2025 Form 10-K [13].
Segment Adjusted EBITDA tells a different and more informative story over the same window. The Crude Oil segment has grown in every one of the last five years, and management guides to a further step up in 2026 as recent acquisitions annualize.
Source: 1Q26 Earnings Call presentation, 8 May 2026, "Plains Well Positioned for Long-Term Growth" [14]; FY2025 Crude Oil Segment Adjusted EBITDA of $2,344 million is also stated in the FY2025 Form 10-K [11].
Consolidated Adjusted EBITDA was $3,374 million in FY2025, of which $2,833 million was attributable to PAA after the 35% outside interest in the Permian joint venture and other consolidated joint ventures [15]. Guidance for 2026 is $2,880 million (± $75 million) of Adjusted EBITDA attributable to PAA and roughly $1,850 million of adjusted free cash flow, on an assumption of Permian production holding relatively flat at about 6.6 million barrels a day [16].
Geography is North America and nothing else.
Source: FY2025 Annual Report (Form 10-K), Notes to the Consolidated Financial Statements, Geographic Data [13].
The United States accounts for 89.8% of revenue and 93.5% of long-lived assets; Canada the balance. Post-Keyera the Canadian share falls further, since the divested business was Canadian and the retained NGL assets are in the United States [1]. Headcount at 31 December 2025 was approximately 3,900 across North America — 2,800 in the United States and 1,100 in Canada, with about 70% in field roles including a 550-person trucking division [17]. Neither PAGP nor its general partner employs anyone directly.
Market Structure
This section is the raw material the Durability tab and the fit jury will lean on, so it is laid out as evidence rather than conclusion.
Physical position. At 31 December 2025 Plains operated 20,405 system miles of crude oil pipeline, carried 9,680 thousand barrels a day of tariff volume and held 76 million barrels of commercial crude storage.
Source: FY2025 Annual Report (Form 10-K), Crude Oil Segment Assets Overview, pipelines and terminals by geographic location [18]. Volumes reflect tariff movements and may count a barrel more than once as it crosses an integrated system.
Share, where it can be sized. In the Permian, Plains operates over 5,600 miles of gathering pipeline representing roughly 3.9 million barrels a day of gathering capacity, of which about 75% sits in the Delaware Basin, and holds interests in long-haul systems representing over 2.8 million barrels a day of takeaway out of the basin [19]. Gathering volumes averaged 3,125 thousand barrels a day in 2025 [18] against a basin producing about 6.6 million barrels a day on management's own 2026 planning assumption [16] — roughly 47% of the basin's wellhead barrels. An analyst characterized the position as "50% of the market share in the Permian" on the Q4 2023 call and management did not contest the figure in reply [20]. All Permian gathering pipelines sit inside the Permian JV, a consolidated entity in which Plains owns 65% [18].
What the structure is not. Plains describes its own competitive environment in terms that rule out monopoly or duopoly. Competition among pipelines turns on transportation charges and access to supply; third-party pipelines with unused capacity compete on the low marginal cost of an incremental barrel; and after multiple Permian expansions the company reports that it "continue[s] to experience heightened competition for uncommitted barrels and contract renewals, which puts downward pressure on tariffs and margins" [21]. This is not a one-year complaint: the same disclosure, in near-identical wording, appears in the FY2021 [22] and FY2023 [23] filings. Named competitor categories include other crude oil and NGL pipeline and terminalling companies, major integrated oil companies and their marketing affiliates, independent gatherers, private-equity-backed entities, banks running trading platforms, and brokers [21]; the named listed set in Plains' own peer group is Energy Transfer, Enterprise Products, MPLX, ONEOK, Western Midstream and Genesis Energy.
The competition shows up in the numbers, not just the risk language. First-quarter 2026 services revenue growth from the Cactus III acquisition was "partially offset by the impact from certain Permian long-haul pipeline contract rates resetting to market during 2025" [24]. Re-contracting at lower rates is the observable test of pricing power, and it went the wrong way.
Buyer concentration, and its direction of travel. ExxonMobil and its subsidiaries accounted for approximately 31%, 31% and 27% of revenues in 2025, 2024 and 2023 [21]. Four years earlier the same customer was 15% of revenues, with Marathon Petroleum at 12% [22]. The company states plainly that losing one of these customers carries the risk of being unable to find a replacement market at a comparable margin [21]. Most of that revenue is merchant buy-sell rather than tariff, which softens the margin exposure, but the counterparty concentration doubled while pricing power was under pressure.
Regulation — a price ceiling, not a moat. Interstate liquids movements are rate-regulated by FERC under the Interstate Commerce Act: tariffs must be on file, just and reasonable and not unduly discriminatory, with rates changed by FERC's indexing methodology or, in specified circumstances, cost-of-service, market-based or settlement rates; pre-1992 rates carry grandfathered status under the Energy Policy Act [25]. This regime constrains what an incumbent can charge; it does not license entry. The real entry frictions are physical and procedural — rights-of-way and easements, and federal water-crossing permits such as Nationwide Permit 12 under the Clean Water Act, whose reissuance and legal exposure the company flags as a project-timing risk [25]. This is not a licensed oligopoly in the sense the framework means when it points at banks and insurers.
Capital intensity. The barrier here is a stock, not a flow. Long-lived assets stood at $22.9 billion at 31 December 2025 [13], built over 28 years: since its 1998 IPO PAA has completed more than 100 acquisitions for roughly $17.5 billion and implemented investment capital projects of roughly $18.7 billion, while returning approximately $21.0 billion to equity holders and moving from non-investment-grade to investment-grade [26]. Current ratings are BBB from Standard and Poor’s and Fitch and Baa2 from Moody's [8]. Annual capital requirements are modest against that base — 2026 guidance is roughly $350 million of investment capital and $185 million of maintenance capital net to PAA, against $2,880 million of Adjusted EBITDA [16] — which is good for cash generation and, on the framework's own logic, a weaker version of the "capital intensity as a moat" argument than the asset base alone suggests.
Consolidation continues to be bought rather than earned: Plains agreed in September 2025 to acquire a 55% non-operated interest in EPIC Crude Holdings for approximately $1.57 billion including about $600 million of debt, plus a potential $193 million earnout [27], and closed the Cactus III pipeline acquisition in the fourth quarter of 2025 [24].
The honest summary of structure: an oligopoly with a genuine scale position — plausibly close to half the Permian's gathered barrels — operating in a market where capacity has been overbuilt, contract rates reset downward on renewal, and a single customer is nearly a third of revenue. Essential product, long history, real assets; not the pricing power the framework's monopoly language contemplates.
Exclusion Screen
Auto manufacturers (X1) — no. Plains is crude oil midstream infrastructure and merchant logistics [1]; no vehicle manufacturing, no automotive supply. The nearest adjacency worth naming is demand-side, not structural: crude ultimately becomes transportation fuel [12], so fleet electrification is a long-horizon volume risk. That belongs to the durability question, not to this exclusion.
China dependence (S1) — absent, and quantified. FY2025 revenue was $39,761 million in the United States and $4,501 million in Canada; long-lived assets were $21,398 million in the United States and $1,480 million in Canada [13]. There is no China revenue line and no China asset line, because there are none. China appears exactly once in the FY2025 Form 10-K, in a risk factor noting that crude is a global commodity whose demand is influenced by conditions in "key consumption markets such as the United States and China" [28]. That is an indirect commodity-price channel shared by every oil-linked business, not a revenue or asset dependence.
Consensus darling (X4) — the positioning is the opposite; the price action is not. On the valuation leg, the operating partnership is the cheapest name in its own disclosed peer group on sales:
Sources: FY2025 revenue as reported by each company; market capitalizations quoted for 31 July 2026 from a public market-data source. Peer set is Plains' own disclosed compensation and TSR peer group; MPLX's ratio is inflated because its revenue carries far less merchant gross-up than PAA's.
That table should be read with its own caveat attached. PAA's revenue is 96% product sales, so price-to-sales measures buy-sell throughput rather than economics; on enterprise value to Adjusted EBITDA the picture is ordinary rather than cheap — PAA's $17.33 billion of equity plus $11.2 billion of net debt against $2.81 billion of last-twelve-months Adjusted EBITDA attributable to PAA [8] computes to roughly 10.2 times, and that multiple is flattered by counting consolidated joint-venture debt against an EBITDA figure net of minority interests. Neither reading resembles an extreme multiple-to-sales darling.
On coverage tone: the sell side is split and unenthusiastic. Fifteen ratings break down as one strong buy, six buy, six hold, no sell and two strong sell, with a mean target price of $24.64 against the $26.33 close on 31 July 2026 — the consensus target sits 6.4% below the market. A name trading through its own average target with a plurality of holds is not one where the consensus already owns the story.
The counter-fact, and it is a real one: the chart has been bottom-left-to-top-right for five years. Total return on the Class A shares indexed to 100 at 31 December 2020 reached 327.17 by 31 December 2025, against 195.98 for the Standard and Poor’s 500 and 291.01 for the Alerian Midstream Energy Index [29]. The shares closed at $26.33 on 31 July 2026 — 56% above the 10 October 2025 trough of $16.85 and 19% above the 30 January 2025 peak of $22.13. The valuation is not consensus-saturated; the entry point is not fear. Those are different findings and both belong on the record.
Two further facts this tab surfaced that other pillars own. PAGP declared distributions of $0.3800, $0.3800, $0.3800 and $0.4175 per Class A share for the four quarters of 2025 against $0.3175 × 3 plus $0.3800 for 2024 [30], with a $1.67 annualized rate targeted for 2026 and approximately $0.15 per unit of annual growth thereafter [16] — a 6.3% forward yield at $26.33. And PAGP itself repurchased nothing in FY2025: Item 5 records "Issuer Purchases of Equity Securities — None" [2]. Capital-return mechanics belong to Self-Help; the year-10 revenue and cash-flow question, with the merchant gross-up stripped out, belongs to Durability.
Limitations
Three gaps are worth naming rather than papering over. The deterministic feature file could not compute market cap, adjusted FCF, balance-sheet class or share-count trend for this run, so the market-cap arithmetic above is built from the filed Class A share count and the dated closing price rather than from the feature. The structured balance-sheet feed reports FY2025 long-term debt of $1,099 million, which is irreconcilable with the $10,698 million of long-term debt in management's own December 2025 financial profile [8]; the filed figure is the one to use. And the run's daily price series shows a first close of $58.59 on 16 October 2013 against an IPO price of $22.00 per Class A share [6], so pre-2016 prices in that feed should not be used for drawdown work; prices from FY2021 onward reconcile to the 10-K cover pages.
What happened to the price
Plains GP Holdings fell 23.9% from a 30 January 2025 close of $22.13 to a 10 October 2025 close of $16.85, and has since recovered to $26.33 — above the pre-fall peak and the highest close since August 2018. The fall had one dated trigger: the 3–8 April 2025 tariff-and-OPEC+ crude shock, four sessions that carried 83% of the peak-to-trough decline. Traded volume peaked at 1.59x the pre-peak median. There is no live dislocation here.
The drawdown, quantified
Peak close (30 Jan 2025)
Trough close (10 Oct 2025)
Peak-to-trough
Days peak to trough
Current close (31 Jul 2026)
Source: derived from the run's daily price file; figures as recorded in the deterministic feature file (fit_features.capitulation_gauge.drawdown).
The measured depth is 23.9%, against the framework's reference case of a 60–70% decline driven by forced selling. The current price sits 56.3% above the trough and 19.0% above the peak the drawdown began from — 26.33 / 16.85 and 26.33 / 22.13 respectively. Consensus mean target price on the same date is $24.64, so the shares change hands 6.9% above where the sell side marks them.
Source: month-end closes derived from the run's daily price file; the intramonth peak ($22.13, 30 Jan 2025) and trough ($16.85, 10 Oct 2025) are not month-end prints and sit outside the plotted line.
Four legs, not one
The 253 calendar days between peak and trough contain four distinguishable stretches, and only one of them is an event.
Source: derived from the run's daily price file; volume multiples measured against the 1,312,023-share median daily volume over the 180 days before the 30 January 2025 peak, the same denominator the feature file uses.
The first stretch is drift: 43 sessions, a 2.3% decline, volume 1.14x the pre-peak median. On the framework's own test — down 10–20% with no event and normal volume is not the moment — that stretch does not qualify as anything.
The 3–8 April window is the event. Four sessions took the shares from $21.61 to $17.25, a 20.2% fall that accounts for $4.36 of the $5.28 total peak-to-trough decline, or 83% of it. The single worst session, 4 April, was -9.6% on 4.1x median volume.
The 19 June to 10 October grind is the other 14.7%, spread over 79 sessions at 1.02x median volume — the shares were changing hands at an ordinary rate the whole way down.
The trigger
The dated adverse event is external and industry-wide, not company-specific. On 2 April 2025 the US administration announced its reciprocal-tariff schedule; on 3 April eight OPEC+ members announced they would advance voluntary-cut unwinds, adding 411,000 barrels a day in May — three monthly increments at once. WTI spot fell 15% from $72.12 on 2 April to $61.05 on 7 April (US Energy Information Administration weekly spot series, reported by Hart Energy and S&P Global Commodity Insights). No Plains filing or release carries an 8-K, guidance revision or press statement dated inside that window.
Management named the same two mechanisms on the next earnings call, 9 May 2025: "The ongoing uncertainty on trade tariffs is weighing on economic forecasts and creating significant volatility. Additionally, the dissension among OPEC members and the prospects of incremental supply coming to market have resulted in a lower price commodity than anticipated at the beginning of the year" [1]. The FY2025 10-K frames the same supply picture structurally, describing a market that is well supplied near-term with uncertainty around OPEC's ability to keep raising production [2].
What the company did not do is cut the number. February 2025 guidance was Adjusted EBITDA attributable to PAA of $2,800–$2,950 million with adjusted free cash flow of $1,150 million [3]. On 9 May the range was left intact, qualified only by "Lower half of guidance range in a $60 - $65/bbl WTI environment", with adjusted free cash flow trimmed to $1,095 million [4]. In August the range was again unchanged, the qualifier restated, and adjusted free cash flow cut to $870 million [5]. In November the range was narrowed to $2,840–$2,890 on a $65/bbl WTI assumption, and the free-cash-flow line swung to negative $900 million [6]. That swing is capital deployment — the $2.9 billion EPIC Crude purchase closed 31 October and 1 November 2025 — not an operating shortfall; the EBITDA line moved by $10 million of midpoint.
Sources: February 2025 deck [3]; November 2025 deck [6]; FY2025 actual per the February 2026 deck [7]. Price column is the closing price on each release date, derived from the run's daily price file.
The delivered figure was $2,833 million of FY2025 Adjusted EBITDA attributable to PAA [7] — 1.5% below the midpoint guided before the fall began, and inside the range set in February 2025. Over the same span the shares fell 23.9%.
The one company-specific event of size inside the window was a disposal, not a disappointment: on 17 June 2025 Plains agreed to sell substantially all of its Canadian NGL business to Keyera for C$5.15 billion (US$3.75 billion) [8]. The shares rose 4.2% the following session on 2.3x median volume.
Earnings dates themselves moved the price very little. The largest reaction to any of the six results releases in the window was -2.7%, on 9 May 2025 — the day a quarter that had missed consensus normalized EPS by 51.9% was reported.
The fear gauge
Peak 20d avg volume / pre-peak median
Avg volume, 19 Jun – 10 Oct leg
20d avg volume at the trough
Source: fit_features.capitulation_gauge.volume_spike for the 1.59x figure (max 20-day average volume in the peak-to-trough leg divided by the median daily volume over the 180 days before the peak); the other two multiples derived from the same daily price file on the same denominator.
The measured spike multiple is 1.59x — the highest 20-day average volume anywhere between peak and trough was 2,090,970 shares, against a pre-peak median of 1,312,023. That window ends 24 April 2025, so the volume peak sits in the April event leg, roughly two weeks after the price low of that leg and nearly six months before the eventual trough.
Source: derived from the run's daily price file; denominator is the 180-day pre-peak median used by fit_features.capitulation_gauge.
Two features of that series bear on the capitulation question. First, the highest monthly volume readings in the whole 23-month window are not in the fall at all — February 2026 (1.63x) and January 2025 (1.57x) sit above April 2025 (1.54x), and the February 2026 reading came while the shares were rising. Second, the 20-day average volume into the 10 October 2025 trough was 0.86x the pre-peak median: the low was set on below-normal turnover.
The behaviour that reads as emotion is confined to four sessions in April, at 3.02x median volume, and it was a whole-market energy event rather than a Plains event. The rest of the decline was orderly. Against the framework's requirement of a traded-volume spike marking peak fear, 1.59x is the measured number, and it does not sit at the low.
Who was selling
Reported short interest is unavailable for this security in the run's data: FINRA returned no position rows and no short-sale volume rows, so short level, change and days-to-cover cannot be stated at all. That is a genuine hole in the seller picture and nothing below substitutes for it.
What the record does show:
No forced or distressed seller is disclosed. No index deletion, fund liquidation or block unwind appears in the SEC filing set, the news corpus or the disclosure trail across the drawdown window.
No insider sold. Across 2024–2026 the Form 4 record contains grants, phantom-share settlements and one 100,000-share gift by director Greg L. Armstrong on 11 August 2025 — and not a single open-market sale. The last open-market insider purchases on file are CEO Willie Chiang's, in May and September 2023 at $13.25 and $16.24.
The company bought, in small size. CFO Al Swanson, on the 9 May 2025 call: "We did buy a small amount in April just as we're going into blackout. It was only about $7.5 million worth. I think it was about 475,000 units" [9]. The feature file records $8 million of FY2025 repurchase cash in total, against a market value in the billions — a gesture, not a support bid.
Dedicated income holders trimmed, gradually. Massachusetts Financial Services filed 5.0% in May 2025, 5.1% in August 2025 and 4.8% in January 2026, dropping below the 5% reporting line; its position has fallen steadily from 8.6% in February 2021. Energy Income Partners went from 5.8% in February 2024 to 4.47% in February 2026. Both are multi-year reductions by long-horizon midstream and income specialists, not a repricing of a view inside the drawdown window.
Taken together, the seller composition is the opposite of the framework's pattern. The evidence shows no anchored holders cutting into a vacuum; it shows a shrinking specialist holder base, an inert insider group, and one macro session at 4.1x volume.
Estimates against price
For the drawdown itself, the run's CapIQ file carries no dated FY2025 or FY2026 consensus history — the revision series (momentum) covers only FY2027 and FY2028 at 30, 90 and 180 days. Company guidance is therefore the dated forward number available across the fall, and it moved 0.3% at the midpoint between February and November 2025 while the price moved 23.9%. Delivered FY2025 EBITDA finished 1.5% below the pre-fall midpoint. Consensus FY2025 EBITDA of $2,802.9 million against the $2,833 million actual says the sell side was, if anything, a touch too low into the print.
Where dated revision data does exist — the recovery — price and estimates moved together, not apart:
Source: consensus figures from the run's CapIQ estimates file (data/sp/estimates.json, momentum block); closing prices derived from the run's daily price file.
Between 3 February 2026 and 31 July 2026, FY2027 consensus EPS rose 23.7% ($1.770 to $2.190) and the share price rose 24.7% ($21.11 to $26.33). The move tracks the estimate change close to one-for-one. The company's own forward number did the same: the 2026 Adjusted EBITDA guide was $2,750 million ±$75 million in February 2026 [7] and was raised by $130 million to $2,880 million ±$75 million on 8 May 2026 [10], on a WTI assumption of $85/bbl for the year [11] against the $65/bbl assumed a year earlier [6].
The signature the framework looks for — a price fall that outruns the estimate cut — is not present in either direction here. On the way down, the price fell 23.9% against a forward number that barely moved; on the way up, price and estimates moved within a percentage point of each other.
Bottom line
There is no dislocation in Plains GP Holdings today. The 2025 drawdown was real, dated and externally caused, but it was 23.9% deep rather than the 60–70% the framework is built around; it carried a 1.59x volume multiple rather than a capitulation; the trough was set on below-normal turnover; and it has been fully retraced and then some, with the shares at $26.33 against a $22.13 pre-fall peak and a $24.64 consensus target. The fall also outran the damage only modestly and briefly — FY2025 EBITDA landed 1.5% below the guidance set before the fall — and the subsequent recovery has tracked rising estimates almost exactly. What the arithmetic in this tab feeds is a starting price near the top of its own multi-year range, not a moment of fear. The quantified gap between damage and price change is worked in Damage Math; what the current price implies for the yield bar is worked in Yield.
Two things would change this read. A crude-price shock of the April 2025 kind at three times the magnitude, or a Permian volume break that pushes the EBITDA guide down by more than the 1.5% the 2025 shock ultimately cost, would create the entry condition that does not exist now. Reported short-interest data, absent here, could also change the seller picture materially in either direction.
The units fell 23.9% from January to October 2025, but the cash the business generates never fell with them. Adjusted EBITDA attributable to PAA rose to $2,833M in 2025 and 2026 guidance was later raised to $2,880M — above 2025 — even after selling the NGL business; the distribution was increased 10% and forward estimates climbed. The only durable damage, a roughly $235M/yr Permian recontracting reset, carries an NPV well below the price drop. At $26.33 the units sit above the pre-drawdown peak.
The near-term hit — the numerator that is mostly missing
Ruchir's dislocation pattern needs a real near-term earnings cut that the market then extrapolates. Here the numerator is close to absent. Full-year adjusted EBITDA attributable to PAA rose from $2,779M in 2024 to $2,833M in 2025 [1], landing 1.1% above the $2,802.9M CapIQ consensus and only 1.5% under the $2,875M midpoint of the guidance range set in February 2025 [2]. The February 2026 outlook then stepped guidance down 2.9% to $2,750M on the NGL divestiture [3] — and by May 2026 that guide had been raised by $130M to $2,880M, above the 2025 actual [4].
Sources: 2024 and 2025 actuals and 2026 guidance, Plains All American investor updates [5] [6]; FY2027–FY2029 are CapIQ consensus mean EBITDA (data/sp/estimates.json).
The quarterly print was noisier than the full year. Normalized EPS missed consensus by 51.9% in Q1 2025 and 21.7% in Q4 2025 — real misses on commodity and timing swings — but Q3 2025 beat by 107.4% and Q1 2026 by 65.8% (CapIQ estimates). The signal that a permanent forecasting error would leave — a durable downward revision to forward cash flow — did not appear. Consensus normalized EPS for FY2027 rose from $1.77 six months ago to $2.19 today, and FY2028 from $1.885 to $2.35; consensus free cash flow climbs from $1,580M in FY2026 to $2,043M in FY2029 (CapIQ estimates).
Source: CapIQ consensus momentum, 180-day (2026-02-03) vs current (2026-08-02) (data/sp/estimates.json).
Capital return moved the way it moves for a business that is fine, not impaired: the distribution was raised 15 cents (10%) to $1.67 per unit annualized, the coverage threshold was lowered from 160% to 150% on "improved visibility," and the special distribution once earmarked for NGL-sale taxes was cancelled [7] [8].
The price move — the denominator that did all the work
The units peaked at $22.13 on January 30, 2025, troughed at $16.85 on October 10, 2025, and closed at $26.33 on July 31, 2026 — a 23.9% peak-to-trough drawdown, per the deterministic capitulation gauge, that has since reversed to sit 19.0% above the pre-drawdown peak.
Peak (2025-01-30)
Trough (2025-10-10)
Current (2026-07-31)
Source: derived from daily prices; drawdown gauge in data/ruchir/fit_features.json (capitulation_gauge).
Market cap is not in the feature file — the run ships no share-count series, so fit_features.market_cap is not_computable. Reconstructing it from the 197.9 million Class A shares in the FY2025 10-K [9] puts PAGP's traded equity at roughly $4.38B at the peak, $3.33B at the trough, and $5.21B now. The peak-to-trough decline was about $1.04B of PAGP equity value.
One scaling note carries through the rest of this tab. PAGP is a look-through holder: it owns about 85% of AAP, which holds 233.0 million PAA common units, so PAGP's traded market cap represents an approximately 28% economic interest (198M of roughly 700M PAA common units) in the operating partnership [10]. The full enterprise carries roughly $11.3B of consolidated PAA face debt at year-end 2025 (about $7.7B net of cash and pro forma for the NGL-sale paydown) [11]. All the guidance drags and offsets below are stated "attributable to PAA," so the arithmetic is run at that enterprise level and then scaled to PAGP's ~28% slice.
The NPV arithmetic — two scenarios, workings shown
The one item that plausibly reduces long-run earning power is the Permian long-haul recontracting reset: as legacy Cactus I/II and Sunrise contracts rolled off, rates reset lower. Only part of it is separately quantified: the 2024-to-2025 walk shows a "lower contracted rates on certain Permian long-haul pipes" driver that Plains did not size [12] — that year the net crude contribution was a positive ~$135M, so the reset was one negative leg inside a segment that still grew — while the 2025-to-2026 walk quantifies a $100M "Cactus I Re-contracting" step [13]. Taking the durable reset at a deliberately generous $235M/yr — the disclosed $100M plus a comparably sized allowance for the earlier, unquantified step — sets the damage ceiling used below. The NGL divestiture's $365M of lost EBITDA is a different thing: it was a sale for CAD$5.15B (about US$3.75B, roughly US$3.0B net) at about 8.5x 2025 EBITDA, with proceeds redeployed into Cactus III and debt paydown [14] — a swap of cash flow for cash, not value destroyed.
Capitalizing the $235M reset under a conservative discount rate gives the plausible ceiling on permanent damage; running it as a level shift that reverses over five years gives the temporary reading. Ruchir's 10% yield bar is used as the discount rate, with 8% shown for sensitivity.
Source: derived — perpetuity ($235M ÷ r) and 5-year annuity of the $235M reset from the 2025 and 2026 guidance bridges [15] [16]; PAGP column scales by the ~28% look-through interest.
Two facts bound the read. First, in the very same 2026 bridge the reset was more than replaced by $380M of contracted growth and self-help — Cactus III +$250M, efficiency +$50M, optimization +$50M, and FERC recoup and tariff escalators +$30M — so run-rate EBITDA rose rather than fell [17]. Net of those offsets, the damage to intrinsic value rounds to zero. Second, even taking the reset gross and permanent, its NPV attributable to PAGP is about $660M (about $825M at 8%) against the roughly $1.04B PAGP equity lost at the trough.
The gap — and its disappearance
At the October 2025 trough there was a gap of the kind Ruchir hunts. PAGP equity had fallen about $1.04B; the plausible permanent damage attributable to PAGP was about $0.66B, and the temporary reading about $0.25B — so the price fell roughly $0.4B more than the harshest damage estimate and about four times the temporary one. Net of the contracted offsets, essentially the entire $1.04B was a re-rating gap rather than a fundamentals gap.
That gap has closed. At $26.33 the units sit $0.84B above the pre-drawdown peak in market-cap terms and $1.88B above the trough; distributable cash flow, the distribution, and forward estimates are all higher than before the shock. The price damage plainly exceeded the plausible NPV damage — but the correction has already been paid to whoever bought the dislocation, not to a buyer today. Worth adding for the framework's own gate: the drawdown was 23.9% on a volume spike of only 1.6x, not the 60–70% capitulation on emotion-driven volume the pattern is built around — the anatomy is covered in Dislocation.
The trial — temporary versus permanent
The temporary-or-permanent question was argued by two opposing corpus-cited briefs and ruled on by three blind judges. Both cases are strong on the record.
The temporary case. Crude Oil segment adjusted EBITDA rose every year through the episode and the FY2025 10-K states it in words — "Crude Oil Segment Adjusted EBITDA increased for the year ended December 31, 2025 compared to … 2024" [18]. The oil-price exposure that drove the selling is small: a $10/bbl move in WTI is worth only about $40M of EBITDA [19]. Guidance was raised, not cut [20], and management framed 2026 as roughly 13% crude-segment growth with volume growth expected to resume in 2027 as gas-takeaway egress constraints clear [21].
The permanent case. The event removed a real operating leg: Plains sold substantially all of its Canadian NGL business, a "strategic shift" that carried $383M of after-tax income from discontinued operations in 2025 [22]. The remaining crude business took a genuine price reset, not a volume dip — "all those volumes have been re-contracted" at lower rates [23] — and the 10-K roots that reset in industry structure, citing "downward pressure on tariffs and margins" [24] in Permian markets that "have become overbuilt" [25]. On this reading the future case rests on different assets — Cactus III, lower taxes, lower maintenance capital — while the old NGL earnings and above-market tariffs are gone.
The judges put the probability the impairment is temporary at 0.71, with the three seats at 0.71, 0.68, and 0.78 (range 0.68–0.78, spread 0.10, mean 0.72). The result is not contested, and it was stable to reading order (temporary-first mean 0.71 versus permanent-first 0.73, a 0.02 gap). This diagnosis probability is the trial's, not this tab's; the arithmetic above is consistent with it but does not set it.
Which line broke, and whether it self-corrects
The line that broke is Permian long-haul crude tariff pricing. As the basin's egress capacity was built out, legacy above-market contracts (Cactus I/II, Sunrise) rolled to lower market rates — the $235M cumulative reset above, disclosed as early as the Q1 2024 call, which flagged Cactus I recontracting at $1.25–$1.50/bbl effective September 2025 [26]. The self-correction mechanism is specific: Plains bought the competing long-haul capacity — the EPIC/Cactus III interests for a $2.9B combined valuation at about 10x forward EBITDA — turning the source of the rate pressure into roughly $250M of its own EBITDA plus $50M of synergies [27]. Post-close leverage is guided back toward the low end of the 3.25x–3.75x range (about 3.5x), and roughly $1,850M of adjusted free cash flow is expected in 2026 excluding the sale proceeds [28].
The structural argument against self-correction is on the record too, and is not softened: the 10-K's own language that Permian markets have become overbuilt, with downward pressure on tariffs and margins, is what would make the reset a recurring repricing cycle rather than a one-time step [29] [30]. What would decide it: whether a further long-haul recontracting drag above $100M appears in the FY2027 guidance bridge, and whether the crude segment grows off the 2026 base without new acquisitions — the tests carried in Durability and Clock.
Bottom line
On the framework's basis — reported free cash flow less stock compensation less the five-year average of acquisition spend — PAGP's FY2025 adjusted FCF is $1,537 million consolidated, and $865 million after the preferred and joint-venture minority claims that sit ahead of the common. That is $1.23 per look-through PAA unit, a 4.7% yield at $26.33. Net debt of 3.9x EBITDA places the name on the 25% levered reference line.
What the adjustment removes
The framework's yield basis is adjusted FCF: reported free cash flow, minus stock-based compensation, minus the trailing five-year average of acquisition spend. fit_features.adjusted_fcf returns not_computable for every year of this run — the structured cash-flow feed behind it carries no stock-compensation or acquisitions field. The reported-FCF series in that feature file is populated, and it reconciles exactly to the filed statements: FY2025's $2,288 million is $2,931 million of net cash from operating activities less $643 million of additions to property, equipment and other [1]. The two missing rows come from the same filed pages.
Stock compensation appears as "Equity-indexed compensation expense": $50 million in FY2025, $52 million in FY2024, $51 million in FY2023 [1], $41 million in FY2022 and $24 million in FY2021 [2], $16 million in FY2020 and $35 million in FY2019 [3]. At roughly 2% of operating cash flow, this is the smallest of the three deductions — a partnership pays its people mostly in cash.
Acquisition spend is the line that moves the number. "Cash paid in connection with acquisitions, net of cash acquired" ran $50 million (FY2019), $310 million (FY2020) [3], $32 million (FY2021), $149 million (FY2022) [2], $425 million (FY2023), $248 million (FY2024) and $2,651 million (FY2025) [1]. The FY2025 figure — the EPIC Crude and Cactus III transactions — is larger than the prior six years combined, and it drags the trailing five-year average to $701 million.
Adjusted FCF = reported FCF − stock-based compensation − trailing five-year average acquisition spend; derived from company filings. Sources: FY2025 10-K, Consolidated Statements of Cash Flows [1]; FY2022 10-K [2]; FY2021 10-K [3].
Two honest limitations sit on that table. The acquisition window is incomplete before FY2023: the corpus holds PAGP 10-Ks back to FY2021 only, so FY2019 through FY2022 use one-, two-, three- and four-year averages rather than five, and their adjusted figures are correspondingly generous. And the reported-FCF series in fit_features pairs total-company operating cash flow with continuing-operations capital expenditure for FY2023–FY2025, because the FY2025 filing restated capex for the pending Canadian NGL divestiture while leaving operating cash flow on a total-company basis. Adding back the discontinued-operations investing outflows of $162 million, $170 million and $197 million [1] lowers adjusted FCF to $1,908 million, $1,581 million and $1,340 million for those three years — a 13% cut to FY2025. Every yield below is computed on the fit_features basis; the alternate is carried through in the sensitivity at the end of the yield section.
Whose cash flow it is
PAGP is not the operating company. It "does not directly own any operating assets"; its sole source of cash is an indirect investment in Plains All American Pipeline, and at 31 December 2025 it held an approximate 85% limited partner interest in Plains AAP through 197.9 million AAP units [4]. AAP in turn owns roughly 233.0 million PAA common units, about 31% of PAA's common units and Series A preferred units combined [4]. PAGP nonetheless consolidates 100% of PAA. Every cash-flow figure above is PAA's.
Dividing $1,537 million of consolidated adjusted FCF by PAGP's own market capitalisation — 197,904,124 Class A shares [5] at the $26.33 close of 31 July 2026, or $5.21 billion — produces 29.5%. That number is an artifact of consolidation, not a yield, and it is what a screen run on this ticker returns.
The look-through arithmetic is exact, and the distribution record proves it. PAA paid $1.5200 per common unit in 2025, of which $354 million went to AAP; AAP passed $301 million of that to PAGP [6], and PAGP paid its Class A shareholders $301 million, also $1.5200 per share [7]. One Class A share carries the economics of one PAA common unit. So the correct denominator is the whole common-unit base — $1,070 million of total 2025 common distributions at $1.5200 implies 703.9 million units [6] — and the numerator has to clear two claims that rank ahead of the common:
- Preferred distributions. $154 million to PAA's Series A holders and $71 million to Series B in 2025 [8].
- Consolidated joint-venture minorities. $447 million paid out to the 35% Permian JV partner, the 30% Cactus II partner and the 33% Red River partner in 2025 [6]. Their cash is inside consolidated operating cash flow; none of it belongs to PAA's common.
FY2025: $1,537m adjusted FCF − $225m preferred − $447m joint-venture minorities = $865 million, or $1.229 per unit on 703.9 million units.
The yield, three ways
Preferred and joint-venture minority distributions from the FY2025 10-K [6] [8], FY2022 10-K [9] [10] and FY2021 10-K [11]; unit counts derived as total common distributions divided by distribution per unit; year-end prices from the daily price feed.
Current. $1.229 per unit against the $26.33 close of 31 July 2026 is 4.67%. On the fully-exchanged share base — 197.9 million Class A plus the 35.1 million Class B shares exchangeable one-for-one into Class A [12] — the per-unit figure is unchanged, because the exchange is one AAP unit for one Class A share and the look-through unit count does not move.
Three-year average. FY2023–FY2025 per-unit adjusted FCF of $2.140, $1.528 and $1.229 averages $1.632. On today's price that is 6.20%.
The company's own baseline. Measured at each fiscal year-end price, the seven readings run 7.5%, 6.0%, 17.7%, 14.6%, 13.4%, 8.3% and 6.4%. The median of the six years through FY2024 is 10.9%.
Derived: adjusted FCF attributable to PAA common, per common unit, divided by the last close on or before each fiscal year-end. Sources: filed cash-flow statements [1] [2] [3] and distribution notes [6].
The framework's jump test asks whether a formerly stable yield has doubled off its own baseline. Here the movement runs the other way. At 4.67% the current reading is 0.43x the six-year median and the lowest of the seven, and the price that produced it is a high, not a low: fit_features.capitulation_gauge records a January 2025 peak of $22.13, an October 2025 trough of $16.85 — a 23.9% drawdown — and a current close of $26.33, which is 19% above the pre-drawdown peak and 56% above the trough. The compression is mostly price. On FY2023's per-unit figure of $2.140, today's price would still yield 8.1%; the fall from 13.4% to 4.7% is roughly 55% price and 45% a smaller numerator.
Sensitivity. On the alternate FCF basis that charges discontinued-operations investing outflows against total-company operating cash flow, FY2025 adjusted FCF is $1,340 million, $668 million to the common, $0.949 per unit — a 3.60% yield. Charging the FY2021–FY2024 average acquisition spend of $214 million instead of the $701 million five-year average lifts the FY2025 figure to $1.921 per unit — 7.30%. The plausible band on today's price is roughly 3.6% to 7.3%, with the framework's own convention at 4.67%.
Which bar applies
fit_features.balance_sheet_class returns unknown — the structured feed's balance sheet reports only $1,099 million of long-term debt for FY2025, which is the term loan alone, not the debt stack. The filed Note 11 gives the full figure: total debt of $11,259 million at 31 December 2025, comprising $563 million short-term and $10,696 million long-term [13], against $329 million of cash [5].
Net debt = $11,259m − $329m = $10,930 million. Adjusted EBITDA attributable to PAA for FY2025 was $2,833 million [14]. Net debt / EBITDA = 3.86x, above the framework's 3.0x levered threshold, so the reference line is 25%.
The company's own measure agrees and then some: crediting preferred equity at 50% debt treatment, it printed a 3.9x leverage ratio at 31 December 2025 against a 3.25x–3.75x long-term target range [15], and 4.1x pro forma at 31 March 2026, expecting roughly 3.5x once the Canadian NGL divestiture closes [16]. The deleveraging is real but it does not change the classification: at ~3.5x the name stays on the levered line.
Position against the bar, in plain arithmetic:
- Against the 25% levered line that the balance sheet selects: 4.67% is 2,033 basis points short.
- Against the 10% default line, had the balance sheet been moderate: 533 basis points short.
- Against the 8–9% fortress line: 333 to 433 basis points short.
No classification rescues the position. The three-year average of 6.20% and the most generous sensitivity of 7.30% are also below all three lines.
The framework's float-retirement check points the same way. The consolidated common equity — 706.6 million PAA common units at the January 2026 declared distribution of $0.4175 per unit on a $295 million total [6] — is worth $18.6 billion at $26.33. Against $865 million of adjusted FCF to the common, retiring the float takes 21.5 years. The framework's absurdity marker is roughly three. The executed repurchase record is covered in Self-Help; the cash number is $8 million of common units bought back in 2025, with $190 million of authorisation left [7].
Normalized mid-cycle yield
Revenue swings violently here — down 30.8% in FY2020, up 80.7% in FY2021, down 9.5% in FY2025 — but almost all of that is commodity price running through PAA's buy/sell arrangements, not volume or margin. The cash-earnings line is far steadier. Adjusted EBITDA attributable to PAA ran $3,227 million in FY2019, $2,546 million in FY2020, $2,196 million in FY2021 [17], $2,510 million in FY2022, $2,711 million in FY2023 [18], $2,779 million in FY2024 and $2,833 million in FY2025 [14]. Peak to trough over seven years is 32%, and the trough was the 2020–21 demand collapse.
That history says FY2025 is not a cyclically depressed year. The seven-year mean of $2,686 million sits 5.2% below the FY2025 actual; restricting to the post-COVID window FY2022–FY2025, the mean of $2,708 million sits 4.4% below. A mid-cycle normalization on this business lowers the yield rather than raising it.
The normalization, with every assumption stated so it can be recomputed under an adjacent window:
- Base. 2026 guided Adjusted EBITDA attributable to PAA of $2,880 million (±$75 million) [16]. This is the first full year carrying the EPIC Crude and Cactus III assets acquired in 2025, so it is the only base that is like-for-like with the current asset footprint.
- Cycle haircut. Apply the 5.2% gap between the FY2019–FY2025 mean and the FY2025 actual: $2,880m × 0.948 = $2,730 million mid-cycle EBITDA. The FY2022–FY2025 window instead gives 4.4% and $2,753 million — a $23 million difference, immaterial to the answer.
- Conversion to cash. Guided 2026 Adjusted Free Cash Flow of approximately $1,850 million on $2,880 million of guided EBITDA is a 64.2% conversion, after cash interest, cash taxes, $350 million of investment capital, $185 million of maintenance capital and distributions to the consolidated joint-venture minorities [16]. The company's Adjusted FCF measure is already net of those minority distributions [19]. Applied to mid-cycle EBITDA: $2,730m × 0.642 = $1,753 million.
- Framework deductions. Less $50 million of equity-indexed compensation. Less an acquisition allowance, where the choice of allowance is the live assumption: the framework's trailing five-year average of $701 million, or the pre-2025 run rate of roughly $322 million a year implied by "over $5.7 billion" of acquisitions from 2016 through 2025 of which approximately $2.8 billion fell in 2025 [20].
- Preferred. Less approximately $205 million of Series A and Series B distributions, being $144 million on the post-repurchase Series A base (the February 2026 payment was $36 million [8]) and roughly $61 million on Series B at the current floating rate.
Mid-cycle result, on 706.6 million units and a $26.33 price:
- With the $701 million allowance: ($1,753m − $50m − $701m − $205m) = $797m, $1.128 per unit, 4.28%.
- With the $322 million allowance: ($1,753m − $50m − $322m − $205m) = $1,176m, $1.664 per unit, 6.32%.
The mid-cycle band of 4.3% to 6.3% brackets the spot reading of 4.67% and sits 1,868 to 2,072 basis points below the 25% line. A reader who prefers a different cycle window can substitute it directly at step 2; because the EBITDA history is tight, a ±10% swing in the mid-cycle EBITDA assumption moves the yield by roughly ±50 basis points — not enough to change the position against any of the three reference lines.
The consensus check
fit_features.consensus_forward_yield carries Capital IQ consensus free-cash-flow means but no yields, because the feature file could not resolve a market cap. The absolute figures are usable directly. There is no direct consensus on "adjusted FCF attributable to PAA common"; the proxy is CapIQ's consolidated free cash flow mean for PAGP, vintage 3 August 2026, from which the same preferred and joint-venture minority claims must be deducted to reach the common. The deduction used below is a flat $655 million a year — $205 million preferred plus $450 million of joint-venture minority distributions, the latter held at the FY2025 actual of $447 million [6].
Derived: Capital IQ consensus free-cash-flow means (fit_features.consensus_forward_yield, vintage 3 August 2026), less $655m of annual preferred and joint-venture minority claims, divided by 706.6m look-through units and the $26.33 close. Minority-distribution anchor: FY2025 10-K [6].
Consensus does not clear the bar, and does not get near it. FY2026 at $1,580.2 million computes to 4.97%; FY2029, the last year with an estimate, to 7.46%. Four years of forward consensus put the yield below even the fortress line, on a balance sheet that selects the levered line. On a 25% bar, consensus would need adjusted FCF to the common of roughly $4.65 billion — about five times the FY2025 figure and more than PAA's entire consolidated Adjusted EBITDA. On a 10% bar it would need roughly $1.86 billion to the common, or $2.5 billion of consolidated free cash flow — 58% above the FY2029 consensus mean.
Because consensus sits below the bar, the framework requires an explicit mean-reversion underwrite rather than an assertion. The honest version is that there is no reversion to underwrite. This is not a name where consensus has cut estimates and anchored the price to a trough: the consensus FCF path rises every year from FY2026 to FY2029, Adjusted EBITDA guidance was raised at the 1Q26 call [16], and the share price is above its pre-drawdown peak. The yield gap is a price gap, not an earnings gap. Closing it to the 10% line from here would require the price to fall roughly 53%, to about $12.30, with FY2027 cash flow held flat — a level PAGP last traded at in 2022. My estimated probability that the look-through adjusted yield exceeds 10% within three years on the current price is below 10%: it requires either a halving of the multiple or a doubling of cash flow, and the mechanism for the second — Permian volume growth plus the acquired EPIC and Cactus III assets — is already inside the consensus path shown above. The 25% line is not reachable on any assumption the record supports.
The reference the market actually pays attention to is the distribution: $0.4175 per share declared for the fourth quarter of 2025 [7] annualises to $1.67, a 6.3% distribution yield at $26.33 — above the 4.67% adjusted-FCF yield. The partnership is distributing more than the framework's adjusted measure earns, which is what the 2025 acquisition year does to a five-year average.
Cash conversion
Derived: reported FCF and revenue from fit_features, reconciled to the filed cash-flow statements [1]; Adjusted EBITDA attributable to PAA from the MD and A non-GAAP reconciliations [14] [18] [17].
The two conversion measures point in opposite directions, and both readings are true.
Reported FCF over revenue improves: 3.9% in FY2019 to 5.2% in FY2025, with FY2025 the best of the seven years. That series is close to meaningless on its own — revenue is $44.3 billion of mostly pass-through crude purchases against $2.9 billion of operating cash flow, so the ratio moves with the oil price as much as with the business. FY2020's 3.3% trough came in the year revenue fell 31%.
Adjusted FCF to the common over Adjusted EBITDA attributable to PAA deteriorates, and this is the measure that matters for the framework: 58.7% in FY2021, 55.2% in FY2023, 38.6% in FY2024, 30.5% in FY2025. Two forces drive it, and neither is a one-year accident. Joint-venture minority distributions rose from $14 million in FY2021 to $447 million in FY2025 [10] [6] as the Permian JV and Cactus II were consolidated — EBITDA that appears in the headline but is not PAA's to spend, running at $541 million of FY2025 Adjusted EBITDA attributable to those minorities [14]. And the acquisition deduction has risen with a genuinely more acquisitive posture: $2.8 billion of the $5.7 billion of deals completed since 2016 fell in 2025 alone [20].
The counter-fact worth holding against that reading: the acquisitions bought EBITDA, and 2026 guidance of $2,880 million is $47 million above FY2025 with the NGL business — $170 million of guided EBITDA — on its way out the door [16]. If the acquisition cadence returns to its pre-2025 run rate, the conversion ratio recovers toward the mid-40s and the mid-cycle yield toward the 6.3% upper case. That is the arithmetic the upper end of the normalization band already assumes, and it still leaves the name well inside every reference line the framework draws.
Data gaps
fit_features returned not_computable for adjusted FCF, adjusted FCF yield, yield baseline, balance-sheet class, FCF stability, float-retirement years and the consensus forward yields — the structured feed carries no stock-compensation or acquisitions row, no share count, and a long-term-debt figure ($1,099 million) that is the term loan rather than the debt stack. Every figure above is rebuilt from the filed pages and the price feed, with the workings shown. The one input that could not be sourced at all is acquisition spend for FY2017 and FY2018: the corpus holds PAGP 10-Ks back to FY2021 only, so the trailing five-year acquisition window is complete from FY2023 forward and short by one to four years before that.
Bottom line
Plains owns assets that cannot be rebuilt and survived a 20% collapse in global oil demand with free cash flow intact. It also earns 42% less per barrel moved than in 2019, guides 2026 adjusted EBITDA down 3%, and books 96% of revenue as merchant crude sales whose dollar value is a price forecast. The conviction sources are real but partial; the year-10 gate does not clear.
The conviction sources, one at a time
The framework's year-10 gate draws conviction from five places: market structure, regulatory entry barriers, capital intensity, essentialness, and operating history. Three of the five apply to Plains with force. Two do not, and saying so is the point of running the list.
Market structure — oligopoly in assets, price-taker in economics
The corporate structure and segment mix are set out in Business; what matters here is share stability. Plains is one of several large owners of Permian crude infrastructure, not one of two. Its own Item 1 describes a market where "existing third-party owned pipelines with excess capacity in the vicinity of our operations also expose us to significant competition based on the relatively low operating cost associated with moving an incremental barrel," and states plainly that "as a result of multiple pipeline expansions in the Permian Basin and other areas… we continue to experience heightened competition for uncommitted barrels and contract renewals, which puts downward pressure on tariffs and margins" [1]. The named competitors run to "other crude oil and NGL pipeline and terminalling companies… major integrated oil companies and their marketing affiliates, independent gatherers, private equity backed entities, banks that have established a trading platform" [1].
Share is stable in barrels and unstable in price. Plains moved 9.68 million barrels per day of pipeline tariff volume in 2025, up from 6.61 million in 2019 [2] [3]. Over the same window, Crude Oil Segment Adjusted EBITDA fell from $2,753 million to $2,344 million [2] [3]. Volumes up 46%, segment earnings down 15%.
Derived: Crude Oil Segment Adjusted EBITDA divided by reported average crude oil pipeline tariff volume times 365 days; 2026 uses guidance midpoints. Sources: FY2025 10-K [2]; FY2023 10-K [4]; FY2021 10-K [3]; 2026 guidance [5].
Sources: FY2025 10-K [2]; FY2023 10-K [4]; FY2021 10-K [3]; 2026 guidance [5].
Two caveats on the ratio. The 2019 base year included a merchant book that captured unusually wide grade and location differentials, so part of the fall from $1.14 is the disappearance of a windfall rather than tariff erosion. And the volume denominator counts a barrel twice when it moves across two connected systems, a convention the filing states explicitly [6]. Neither caveat rescues the 2021-to-2025 stretch, where the base year is post-windfall and the convention is unchanged: $0.843 to $0.663, down 21%, on volumes up 56%.
A market structure that lets a participant grow volumes by half while earning less per unit is an oligopoly in physical assets and something closer to a commodity market in pricing. That distinction matters more at year ten than at year one.
Regulatory entry barriers — a rate ceiling, not a moat
Interstate liquids pipelines file tariffs with FERC under the Interstate Commerce Act, and most, including Plains, adjust rates within an annual index ceiling that FERC resets every five years [7]. This regime constrains what an incumbent may charge; it does not decide who may build. It is the opposite of the bank or insurer case the framework leans on, where the regulator's licence itself keeps entrants out.
What the regime does block is fast, cheap greenfield construction. Permitting under the Clean Water Act nationwide permit programme, the Endangered Species Act, and the National Environmental Policy Act is described in the filing as capable of making projects unviable through "lengthy regulatory review and approval requirements" [7]. And Plains cannot condemn allotted tribal land, which cuts both ways: it protects incumbency in some corridors and threatens Plains' own rights-of-way in others [8].
The honest grade: permitting friction is a genuine barrier to new long-haul capacity and a weak one against gathering-system competitors, who build inside a basin on private acreage. Regulatory entry barriers apply partially here, and not in the form the framework's precedents describe.
Capital intensity — the strongest source, and it is genuine
Plains carries $16.9 billion of net property and equipment, $900 million of linefill, $2.8 billion of equity-method investments and $1.8 billion of net intangibles [8]. In the Permian alone it operates over 5,600 miles of gathering pipeline representing roughly 3.9 million barrels per day of capacity, an intra-basin system of roughly 3.1 million barrels per day, and interests in long-haul systems totalling over 2.8 million barrels per day of takeaway [6]. Company-wide the footprint runs to over 20,000 miles of active pipeline [9].
Nobody replicates a wellhead-to-Gulf-Coast gathering and takeaway network for a marginal return. Gathering pipelines are further "supported by long-term acreage dedications" [6], which tie acreage rather than volumes and survive a producer's decision to slow drilling. This conviction source applies in full.
It also carries the framework's own warning attached: capital-heavy essentials survive, but they are not always good businesses. The per-barrel series above is what that looks like from inside.
Essentialness — tested in 2020, and it held
The most useful evidence on essentialness is not a demand forecast but a demand shock. Global consumption fell by roughly a fifth in the second quarter of 2020. Plains' pipeline tariff volumes fell 8%, from 6,613 to 6,082 thousand barrels per day; Crude Oil Segment Adjusted EBITDA fell 20%, from $2,753 million to $2,216 million [3]; reported free cash flow stayed positive at $772 million [10].
2020 Tariff Volumes
2020 Crude Segment EBITDA
2020 Free Cash Flow ($MM)
PAA Distribution 2019 to 2021
Sources: FY2021 10-K, Crude Oil Segment operating results [3] and subsidiary distributions [11]; consolidated cash flow data [10].
The distribution did not hold. PAA paid $1.38 per common unit in 2019, $0.90 in 2020 and $0.72 in 2021, a 48% reduction across two years [11]. That was a capital-allocation choice to delever rather than a cash-generation failure, and the payout policy is examined in Self-Help. For the durability question, the relevant fact is that the barrels kept moving and the cash kept coming.
Management's forward view is that demand grows: "we expect crude oil demand to continue increasing, driven largely by our view that hydrocarbon-based fuels are the most efficient fuels for the transportation of people and goods" [12]. That is an interested party's forecast, and it is placed directly above an EIA chart showing implied global stock builds of roughly 2 to 3 million barrels per day through 2027 [12]. Essentialness applies; abundance is the near-term condition.
Operating history — 28 years, through four cycles
PAA was formed in 1998 and has since completed and integrated over 100 acquisitions for roughly $17.5 billion, implemented investment capital projects totalling roughly $18.7 billion, returned roughly $21.0 billion to equity holders, and moved from non-investment-grade to investment-grade credit [13]. PAGP itself, the listed Class A vehicle, dates from the October 2013 IPO. Twenty-eight years of operating history spans 2008-09, the 2015-16 crude collapse, 2020, and the 2022 spike.
The framework asks for 30 to 50 years. Plains is just short of the lower bound at the asset level and twelve years into the listed structure. The record is long enough to be evidence and carries one scar the framework should see: those 100-plus acquisitions mean the operating history is partly a history of buying operating history.
The structural threats, hunted
Recontracting, quantified — the threat with a number attached
The most concrete year-10 threat is not distant. It is already in the 2026 guidance walk. Management's own bridge from 2025 to 2026 adjusted EBITDA takes $100 million out for "Cactus I Re-contracting" and $365 million out for the Canadian NGL sale, and puts $250 million back from the Cactus III acquisition plus $130 million from efficiency, optimisation and tariff escalation [14].
Source: Fourth-Quarter 2025 earnings presentation, Key Drivers 2025 to 2026 [14].
The 10-K names the mechanism without the number: 2025 crude segment results were held back by "the impact from certain Permian long-haul contract rates resetting to market in 2025" [15]. The CFO put it more directly on the fourth-quarter call: fourth-quarter crude segment adjusted EBITDA of $611 million reflected "a full quarter impact of recontracting on our long-haul systems" [16].
Sizing the year-10 exposure. The contracts that reset are the Permian long-haul agreements written in 2018-19, when takeaway was scarce and shippers paid for it. The weighted average remaining term of Plains' minimum volume commitments and acreage dedications is roughly five years [17]. On a ten-year view, therefore, effectively the entire contracted book resets twice. If a further two rounds of resets each carry a headwind of the order of the $100 million already booked, that is roughly $200 million of recurring adjusted EBITDA, or 7% of the $2,750 million 2026 guide [5], before any offsetting escalation or new commitment. That is a bounded estimate, not a forecast; it assumes the next two resets look like the last one.
The fair counter-fact sits in the same filings. The contracted revenue backlog has been refilled every single year and has grown, not shrunk. Total remaining performance obligations rose from $1,949 million at the end of 2021 to $3,430 million at the end of 2025, and the year-ahead figure has climbed steadily from $416 million to $639 million [18] [19] [20].
Sources: FY2025 10-K [18]; FY2023 10-K [21]; FY2021 10-K [19].
Each vintage traces the same downward slope and each new vintage starts higher. The roll-off shape is a disclosure artefact of a business that recontracts continuously, not evidence of decay. What the table cannot show is the price at which the refilling happens, and that is what the $100 million tells us.
One scale check on the backlog. Committed revenue of $639 million for 2026 sits against reported services revenues of $1,761 million for 2025 [22]. The filing explains the gap: the table excludes "expected revenues from legacy shippers not underpinned by minimum volume commitments" and excludes acreage dedications entirely, because they "require us to perform future services but do not contain a minimum level of services" [23]. Roughly two-thirds of fee revenue therefore rests on uncommitted, walk-up and dedication-based volume that reprices continuously. That is the exposure the recontracting number is measuring.
Regulatory reversal — FERC has proposed cutting the escalator
The index that governs annual tariff increases is up for its five-year reset on 1 July 2026. On 20 November 2025 FERC issued a Notice of Proposed Rulemaking proposing an index level of the Producer Price Index for Finished Goods minus 1.42% for the period 1 July 2026 to 30 June 2031 [24]. The index currently in force is PPI-FG plus 0.78%, reinstated by FERC in September 2024 after the D.C. Circuit vacated an intervening downward revision in LEPA v. FERC [24]. The proposed change is 220 basis points of annual escalation on indexed rates, compounding over five years to roughly 11% of tariff ceiling relative to the present index. FERC's methodology also compels a filing to lower rates in any year the index is negative [24].
Plains' own FY2025 10-K describes the LEPA litigation and warns that "the final resolution of these petitions could have an adverse effect on our cash flows" [7], and separately notes that FERC "could order PAA to reduce its rates and could require the payment of reparations to complaining shippers for up to two years prior to the complaint" [25]. It does not disclose the November 2025 five-year-review NOPR; the proposal is sourced here from a peer's filing on the same regime. The FY2025 guidance walk does credit "FERC recoup / Tariff escalations / Other" for $30 million in 2026 [14], so the escalator is a live contributor, not a rounding item.
Volume — the growth engine is guided to stall
Every year since 2020, rising Permian volume has offset falling per-barrel economics. For 2026 the company assumes Permian basin production is "relatively flat" at roughly 6.6 million barrels per day [5], and on the first-quarter 2026 call management confirmed "our assumption for the Permian this year was flat" [26]. The EIA's January 2026 Short-Term Energy Outlook is the same picture and then worse: Permian output of 6.6 million barrels per day in 2026, easing to 6.5 million in 2027, with total US crude falling from 13.6 to 13.3 million barrels per day, on rig activity declining as prices sit below stated Midland and Delaware breakevens.
Plains' own sensitivity puts a 100 thousand barrel per day change in total Permian production at $10 to $15 million of adjusted EBITDA, and a $10 per barrel move in WTI at $40 million [5]. Those coefficients are modest: a 500 thousand barrel per day basin decline costs $50 to $75 million, about 2% of guided EBITDA. The volume threat to year-10 cash flow is real but second-order; it matters mainly because volume growth is what has been paying for tariff compression.
Guided 2026 pipeline volumes of 10,350 thousand barrels per day are 7% above 2025 [5], on a flat basin. That increment is bought, not grown: it is Cactus III, acquired in 2025.
Growth by acquisition — the pattern, priced
Cash paid for acquisitions was $2,651 million in 2025, against $248 million in 2024 and $425 million in 2023 [27]. Since 2016 Plains has spent over $5.7 billion on acquisitions, roughly $2.8 billion of it in 2025 alone [28]. The 2026 walk shows where that spend lands: $250 million of acquired EBITDA is filling a hole created by $100 million of recontracting and $365 million of divestiture [14]. The company is buying replacement earnings at a rate that matters to the framework's adjusted-FCF definition, which deducts the five-year average of acquisition spend precisely to catch this. That arithmetic belongs to Yield; the durability observation is narrower and harder — an earnings base that requires continuous purchase to stay level is not the same asset as one that compounds on its own.
Execution here is good. The Cactus III integration was already at half its $50 million synergy run rate one quarter after closing [16]. Execution is not a moat, and a year-10 case that leans on management continuing to buy well has no structural protection in it.
Customer concentration
ExxonMobil and its subsidiaries accounted for approximately 31%, 31% and 27% of revenues in 2025, 2024 and 2023 [29]. The filing states the consequence: "if we were to lose one or more of these customers, there is risk that we would not be able to identify and access a replacement market at a comparable margin" [29].
The mitigant is real. The majority of that revenue is Crude Oil segment merchant activity — barrels bought and resold at multiple locations [29] — which passes through at a thin margin rather than contributing 31% of EBITDA. Concentration at 31% of revenue overstates the economic exposure, and the counterparty is investment grade. Rated a live but not decisive threat.
Substitution and technology
Plains' filing names the mechanism: demand fluctuates with "fuel conservation measures, alternative fuel adoption, governmental regulation, including climate change regulations, and technological advances in fuel economy and energy generation and storage technologies," and legislative action to reduce greenhouse gas emissions "could… accelerate the adoption of alternative energy technologies, thereby causing a reduction in the demand for such products" [30].
The framework's sharper question — is anyone's margin here an Amazon opportunity — has a specific answer for crude midstream, and it is mostly no. There is no software substitute for moving a physical barrel 500 miles, and the alternatives the filing names (truck, rail, barge) "typically cost more" [1]. The substitution risk is not to the transport function; it is to the product. On a ten-year view the honest statement is that US crude demand is a wide distribution and the Permian's share of US supply is high, so a slow-transition scenario damages volumes gradually rather than abruptly. This threat is real and slow-acting, and the volume sensitivities above bound it: it is smaller than the pricing threat over the same window.
Exclusion-relevant facts
Revenue is entirely North American — $39,761 million United States and $4,501 million Canada in 2025 [31]. No China revenue or asset dependence appears anywhere in the record. Structural-decline evidence is addressed directly below.
The disqualifier check
The framework's hard disqualifier is revenue declining at a high single-digit rate for three consecutive fiscal years after a long existence. The deterministic feature file reports three_year_hsd_decline: false and consecutive_decline_years: 1 (fit_features.revenue_trajectory). The full ten-year series behind that flag:
Source: reported consolidated revenues, FY2016-FY2025 [32]; FY2023-FY2025 as restated for continuing operations in the FY2025 10-K [33]. Series matches fit_features.revenue_trajectory exactly.
Source: as above; figures identical to fit_features.revenue_trajectory.per_year.
Declines occurred in 2019, 2020, 2023 and 2025. The longest run is two years (2019 and 2020, at -1.1% and -30.8%), and the most recent decline stands alone at -9.5%. The three-consecutive-year test is not met and is not close to being met.
The flag is correct and the flag is also nearly meaningless for this company, which is a point the gate needs made rather than buried. Of the $44,262 million of FY2025 revenue, crude sales were $42,408 million; transportation tariffs were $1,330 million and terminalling, storage and other fees were $349 million [22]. Roughly 96% of the top line is crude bought and resold, recorded gross. Revenue moves with the WTI price and the merchant book's size, not with the health of the pipeline network. The 31% collapse in 2020 and the 81% rebound in 2021 were price, not business.
The service line is the one that tests the business:
Source: reported services revenues by fiscal year [32]; FY2023 onward on a continuing-operations basis after the Canadian NGL business was reclassified to discontinued operations [33], so growth from 2022 to 2023 is understated on this basis.
Fee revenue has risen 49% since 2016 and has fallen in only two years, 2020 and 2021, at -11.8% and -3.0%. On the measure that tracks the actual pipeline franchise, there is no structural decline in evidence. X3 checked and absent.
FCF consistency
The framework's P2 test is the stability of the rolling five-year average of adjusted free cash flow — reported FCF less stock-based compensation less the five-year average of acquisition spend.
That series cannot be computed from the deterministic feature file. fit_features.fcf_stability returns an empty rolling_5y_avg array with cv_of_rolling_avg: null, and the stated reason is "fewer than five consecutive adjusted-FCF years"; the underlying adjusted_fcf.series shows sbc: null for all ten fiscal years and treats acquisitions as an "implicit zero" under a complete-row rule. Both inputs exist in the filings. Equity-indexed compensation expense was $50 million in 2025, $52 million in 2024 and $51 million in 2023, and cash paid for acquisitions net of cash acquired was $2,651 million, $248 million and $425 million over the same three years [27]. Treating a company that has spent over $5.7 billion on acquisitions since 2016 [28] as having spent zero materially overstates adjusted FCF. The correct figures are not substituted here; the gap is logged, and the adjusted computation is Yield's.
What can be shown on the primary record is reported free cash flow and its rolling five-year average:
Reported FCF from consolidated cash flow data [10], reconciling to the FY2025 10-K cash flow statement for FY2023-FY2025 [27]; rolling average derived. This is reported FCF, not the framework's adjusted FCF, which is not computable from fit_features.
The rolling average has risen in every window, from $783 million (FY2016-2020) to $2,048 million (FY2021-2025), and has never declined. Year-to-year FCF is volatile — the 2016-to-2017 swing was $2,088 million — which the framework tolerates. The five-year mean is not.
One negative year sits in the series. FY2016 reported FCF was -$616 million: $718 million of operating cash flow against $1,334 million of capital expenditure [10]. That is a growth-capex episode at the bottom of a crude cycle, not the underwriting-loss cadence the framework describes for insurers and banks — there is no mechanism here that periodically requires a loss year, and none has recurred as capital spending fell to a $408 to $643 million range across 2023 to 2025 [27]. On the reported basis, P2 reads as consistent. On the framework's adjusted basis, it cannot be assessed, and the year with $2.65 billion of acquisition spend is exactly the year where the two bases would diverge most.
The year-10 case, both ways
The strongest case that year-10 revenue and adjusted FCF are higher
The asset base is not reproducible and is not being challenged by a cheaper technology. Over 20,000 miles of active pipeline, $16.9 billion of net property and equipment, and Permian gathering supported by long-term acreage dedications that bind acreage rather than volumes [6] [8] [9]. Crude Oil Segment Adjusted EBITDA has risen in each of the last four fiscal years, from $1,909 million in 2021 to $2,344 million in 2025, and is guided to $2,640 million for 2026 [3] [2] [5]. The contracted backlog is 76% larger than four years ago [18] [19]. The business kept generating positive free cash flow through the worst demand shock in the history of the oil market, and reported FCF has risen from $772 million in 2020 to $2,288 million in 2025 [10]. Management is recontracting Cactus III "for term" and expects "to contract at higher rates than before with potentially new counterparties" [34], which, if Permian-to-Gulf-Coast utilisation stays as tight as current basin capacity implies, is a reasonable expectation rather than a hope.
The strongest doubt
Two legs of the gate carry independent problems.
The revenue leg is not underwritable in the framework's terms. Roughly 96% of reported revenue is crude bought and resold at prevailing prices [22]. "Year-10 revenue higher than today" for PAGP is a statement about the 2036 WTI price, and the record shows what that does: -31% in 2020, -17% in 2023, -9% in 2025 (fit_features.revenue_trajectory). No degree of business-quality analysis produces very high conviction about a commodity price a decade out.
The adjusted-FCF leg carries a directional, quantified problem. Per-barrel segment economics have compressed 21% since 2021 and 42% since 2019, on volumes up 56% and 46% respectively. The company's own 2026 bridge takes $100 million out for a single pipeline's recontracting and guides headline adjusted EBITDA down 3% [14]. The weighted average remaining term of committed contracts is roughly five years [17], so the book resets twice inside the window. FERC has proposed cutting the indexed escalator by 220 basis points from July 2026 [24]. The basin that supplied every barrel of volume growth is guided flat for 2026 and forecast by the EIA to decline in 2027. And the mechanism that has held the line — $2.65 billion of acquisitions in one year [27] — is the same spend the framework's adjusted-FCF definition subtracts.
The read
There is a genuine doubt, and it is specific: year-10 adjusted free cash flow requires either that per-barrel economics stop compressing after seven consecutive years of compression, or that acquisitions keep buying replacement earnings — and the framework's adjusted-FCF definition charges the second path against the very number it is meant to protect. Against that sits the fact that Crude Oil Segment Adjusted EBITDA has risen four years running and the contracted backlog is 76% larger than in 2021, so the compression has so far been outrun rather than lost to. The gate does not clear.
What would change this read, in order of decisiveness. A completed Cactus III and Cactus I recontracting cycle at rates at or above the expiring ones, disclosed with the dollar effect, would falsify the compression thesis directly — management said an update is due "in the coming quarters" [34]. A final FERC index for July 2026 to June 2031 at or above PPI-FG flat, rather than the proposed minus 1.42%, would remove the regulatory leg. Segment EBITDA per tariff barrel stabilising above $0.70 across two consecutive years without acquisition contribution would answer the core arithmetic. Conversely, a third consecutive annual recontracting headwind of $100 million or more, or Permian production declining faster than the EIA's 2027 path, would harden the doubt into a structural finding.
What this tab establishes
Plains can comfortably outlast its problem: investment-grade ratings, no senior note maturity between 2027 and 2028, a 5.00x covenant against 4.1x actual leverage, and $3.3 billion of divestiture cash received in May 2026. What it does not have is a repurchase engine. Cash spent on buybacks over the last three years totals $8 million; the unit count has risen since January 2023; and management ranks repurchases last among four uses of capital.
Debt and Maturities
At 31 December 2025 total debt stood at $11,259 million against $329 million of cash — up from $7,618 million a year earlier, the increase funding the EPIC Crude and Cactus III purchases [1]. The stack is $9,118 million of PAA senior notes net of discounts, $970 million of commercial paper, a $1,099 million term loan and $72 million of other borrowings [1].
The maturity schedule is the reason the balance sheet is not the binding constraint. The debt footnote gives the next five years and a residual; the company's own investor deck breaks the residual out year by year.
Sources: FY2025 Annual Report (Form 10-K), Note 11 Debt — Maturities, which gives 2026 $750M, 2027 nil, 2028 nil, 2029 $1,000M, 2030 $750M and $6,683M thereafter [2]; the post-2030 breakout is from the May 2026 investor presentation [3].
The weighted average maturity of the senior notes is approximately ten years and the weighted average coupon approximately 5.0% [2] [3]. Only one senior note matures before 2029: the $750 million 4.50% issue due December 2026, which management has said will be repaid from divestiture proceeds rather than refinanced [8].
Covenants. The credit agreements and the term loan require a trailing-four-quarter debt-to-EBITDA ratio no greater than 5.00 to 1.00, widening to 5.50 to 1.00 for three quarters following an acquisition above $150 million; letters of credit and hedged-inventory borrowings are excluded from the calculation. The agreements prohibit distributions and unit repurchases only while a default is continuing — so long as Plains is in compliance, its ability to distribute available cash is unrestricted. Plains was in compliance at year-end 2025 [2]. Against that 5.00x limit, the reported leverage ratio at 31 March 2026 was 4.1x on a definition that already gives the preferred units 50% debt treatment, versus a long-term target range of 3.25x to 3.75x, with Fitch at BBB, Standard and Poor's at BBB and Moody's at Baa2 [3].
Liquidity. At year-end 2025, availability under the $1,350 million senior unsecured revolver plus $1,298 million under the senior secured hedged inventory facility, less $970 million of commercial paper outstanding, left $1,678 million of undrawn capacity; with cash, total liquidity was $2,007 million [4]. The revolver runs to August 2029 and the inventory facility to August 2027 [5].
Refinancing at current rates. New money in 2025 was priced at 4.70% for 2031 paper, 5.60% for 2036 paper and 5.95% for the 2035 issue [6]. The notes coming due next carry lower coupons — 3.55% in 2029 and 3.80% in 2030 — so refinancing $1.75 billion at roughly 125 basis points more costs about $22 million a year against adjusted EBITDA attributable to Plains of $2,833 million in 2025. Cash interest paid was $377 million in 2023, $351 million in 2024 and $431 million in 2025 [9].
The $1.1 billion term loan drawn in December 2025 to retire assumed EPIC debt matures November 2027 and carried a mandatory prepayment trigger on the closing of the Canadian NGL divestiture [5]. That sale closed on 12 May 2026 for approximately $3.3 billion of net cash proceeds, earmarked to repay indebtedness and expected to bring leverage toward the middle of the target range [7].
On the first half of the question — can the company outlast the problem — the answer is unambiguous. On the second half, the allocation of that headroom is the constraint, and it is a chosen one rather than an imposed one.
Repurchases Executed
Ruchir's test is cash actually spent, not authorisations announced. The Board approved a $500 million common equity repurchase programme in November 2020, covering PAA common units and PAGP Class A shares interchangeably. Five and a half years later, $190 million of that authorisation remained unused at 31 December 2025 [10].
Sources: repurchase cash from the Consolidated Statements of Cash Flows in the FY2021 [11], FY2023 [12] and FY2025 [9] Form 10-Ks; PAA common unit distributions from the FY2021 [15] and FY2025 [14] Form 10-Ks.
The record year by year: $50 million in 2020 and $178 million in 2021 [11], $74 million in 2022 and nil in 2023 [12], nil in 2024 and $8 million in 2025 [9]. Total spend across six years is $310 million. The deterministic feature file records the same two most recent figures — nil for FY2024 and $8 million for FY2025 (fit_features.share_count_trend.buyback_cash_per_year).
Prices paid were good. The 2020 tranche was 6,222,748 units for $50 million, or $8.03 per unit; the 2021 tranche 18,061,583 units for $178 million, or $9.86 [13]. The 2025 tranche was approximately 0.5 million units for $8 million, near $16 [10]. Against a 31 July 2026 close of $26.33, every unit bought back was bought cheap. The buying simply stopped: over 2023, 2024 and 2025 combined, $8 million went to repurchases while $2,709 million went to common distributions.
One repurchase of size did happen in the period, and it was not of common units. In January 2025 PAA bought back approximately 12.7 million Series A preferred units — 18% of the class — from EnCap Flatrock Midstream, an entity affiliated with a member of the board, at the $26.25 issue price for $333 million plus $10 million of accrued distributions [10] [27]. At the 9.375% reset rate that is $31 million of annual preferred distributions retired for $333 million — a defensible use of cash, and 42 times what the common got that year.
The unit count
PAA does not publish a units-outstanding roll-forward in the PAGP filings, but each 10-K states the January-declared quarterly distribution in both dollars and dollars per unit, which pins the count at a consistent record date every year.
Derived as the declared fourth-quarter distribution divided by the per-unit rate, from each Form 10-K: $127M at $0.18 (Jan 2022) [15], $187M at $0.2675 (Jan 2023) [16], $223M at $0.3175 (Jan 2024) [17], $267M at $0.38 (Jan 2025) [18] and $295M at $0.4175 (Jan 2026) [14]. Rounding of the dollar totals gives roughly plus or minus one million units per point.
The shape is a shallow V. Distributions paid on a full-year basis imply about 727.5 million units in 2019 and 727.8 million in 2020 [15]; the $302 million of repurchases in 2020 to 2022 took the count to a trough of 699.1 million at the January 2023 record date; it has risen every year since, to 706.6 million in January 2026. That is 7.5 million units added, 1.07% over three years, or roughly 0.36% a year.
The driver is equity compensation, not acquisition currency. Equity-indexed compensation expense ran $51 million in 2023, $52 million in 2024 and $50 million in 2025 [9]. Ruchir's framework treats a share count that keeps rising on stock compensation or serial M&A as disqualifying, and on the letter of that test the count is rising. Two facts sit against the severity of the reading, and both belong in it: the drift is 0.36% a year, an order of magnitude smaller than the cases the rule was written for; and the acquisitions have not been paid for in units. Plains has made 17 bolt-on acquisitions since 2022 for approximately $4.3 billion of cumulative net investment [19] and funded them with debt and divestiture proceeds; the 10-K states plainly that in the near term the company does not plan to issue common equity to fund such expenditures [31].
What is absent is the offset. A programme that retires 0.36% of the count a year would neutralise the drift for roughly $67 million annually at the current price. The last three years produced $8 million.
Where the Next Dollar Goes
Brokers have asked the question on every recent call, and management's answer has been consistent and explicit about ordering. On the Q1 2026 call the CFO set it out in full:
On capital allocation, with the proceeds from NGL, we anticipate paying down a little over $3 billion of debt, which would be the term loan, the outstanding CP we have, and a $750 million note that matures later this year. Post that, we expect to be right at the midpoint of our leverage range, about 3.5x… Our capital allocation priorities remain: maintaining distribution growth; funding investments, whether organic or M&A-related; taking out preferreds should leverage remain at or below the bottom end of the range; and opportunistic share repurchases.
— Al Swanson, CFO, Q1 2026 earnings call, 8 May 2026 [8]
Repurchases are fourth of four, and gated twice — behind roughly $3 billion of debt reduction, and then behind a leverage condition of at or below 3.25x that the company does not expect to satisfy before it has first funded distribution growth and investment. Three months earlier, asked directly whether the priorities had shifted, the same executive gave the same ranking: "Our primary way of returning cash to shareholders is going to be through distribution growth… Secondly, we do have some preferred securities as well as common unit repurchases. Those will be more on an opportunistic basis" [21]. And on the Q3 2025 call, asked what happens once leverage is back at the midpoint: "quite honestly, you're sitting at the midpoint of the leverage range and still seeing potential opportunities to deploy capital with good return, we'll be more biased towards looking at the bolt-ons at that point" [22].
The company's own materials rank it the same way. The May 2026 deck lists four levers to drive growth — growth capex, the $100 million cost programme, bolt-on M&A at 13% to 15% IRR, and last, "Capital Optimization: Preferreds (~$2.3 Bln) / Opportunistic buybacks" [20].
This is not an accident of the current cycle. The stated preference for other uses has been stable for years: in November 2023, asked whether the preferreds might be taken out, the CFO said "there's been no change in our thinking around the preferreds… we won't sacrifice our financial flexibility," pegging the weighted average cost of capital at 11% to 12% [32].
Insider buying. The Form 4 record holds 127 transactions between May 2023 and August 2025, of which two are open-market purchases, both by the Chairman and CEO: 75,000 shares at $13.247 on 8 May 2023 for $994 thousand, and 62,000 shares at $16.237 on 28 September 2023 for $1.007 million [25]. No insider bought in the open market during the January-to-October 2025 drawdown.
The Levered Exception
Ruchir's framework tolerates leverage only where the adjusted yield is extreme — roughly 25% to 40% — and where two further conditions hold alongside it. The company qualifies as levered: net debt of $10,930 million against 2025 adjusted EBITDA attributable to Plains of $2,833 million is 3.86x, and the company's own reported ratio was 4.1x at 31 March 2026 [1] [3]. All three legs have to compute together, and two do not.
Leg 1 derived from reported figures as set out below; leg 2 from the January-declared distributions in the FY2021 to FY2025 Form 10-Ks [14]; leg 3 from reported free cash flow and revenue, fit_features.adjusted_fcf.series and fit_features.revenue_trajectory.per_year.
Two of three is not the exception. The yield gap is the decisive part of the arithmetic — the levered bar sits at roughly three times where the adjusted yield computes, and no reasonable treatment of the acquisition deduction closes that distance.
Years to Retire the Float
The feature file cannot answer this one. fit_features.float_retirement_years is null, because market_cap is null ("no positive annual period-end or outstanding share count") and adjusted_fcf.latest_adjusted is null ("missing SBC for FY 2016 through 2025; no complete consecutive five-year acquisition window with SBC"). Both inputs are in fact in the filings — the cash-flow statement reports equity-indexed compensation expense of $50 million and cash paid for acquisitions of $2,651 million in 2025 [9], and 197,904,124 PAGP Class A shares were outstanding at 20 February 2026 [30] — so the gap is one of data plumbing rather than disclosure. The arithmetic below is computed from those filed figures and is not the deterministic feature; it is logged as a data gap.
The float that matters is the whole common-unit stack, because the cash flow being measured is PAA's. At the 31 July 2026 close of $26.33, 706.6 million PAA common units are worth $18,605 million.
Adjusted FCF = reported FCF minus stock-based compensation minus the trailing five-year average of acquisition spend; reported FCF of $2,288M is the feature-file figure (fit_features.adjusted_fcf.series, FY2025), equal to operating cash flow of $2,931M less $643M of continuing-operations capital additions. Compensation, acquisitions (2021 $32M, 2022 $149M, 2023 $425M, 2024 $248M, 2025 $2,651M, averaging $701M) and the noncontrolling-interest distribution split are from the FY2023 [12] and FY2025 [9] Form 10-K cash-flow statements, the PAA common distribution table [14] and the preferred distribution tables [27].
The JV-minority deduction is the residual of the $1,441 million paid to noncontrolling interests in 2025 after the $716 million to public common unitholders, $53 million to AAP's outside partners and $225 million to the two preferred classes — $447 million leaking to the 35% partner in the Permian JV, the 30% partner in Cactus II and the 33% partner in Red River.
So: $18,605 million of common equity divided by $1,537 million of adjusted FCF is 12.1 years, and divided by the $875 million that actually reaches common holders, 21.3 years. The 2025 acquisition figure is an outlier that pulls the five-year average up; substituting the 2021 to 2024 average of $214 million raises adjusted FCF to $2,024 million and the common-available figure to $1,362 million, giving 9.2 and 13.7 years respectively. Ruchir's absurdity threshold is around three years. The range here is nine to twenty-one.
Distribution Safety
At $1.67 per share annualised against the 31 July 2026 close of $26.33, the distribution yield is 6.3% [10]. At that level the yield is most of the near-term return, so it carries the full test.
Source: May 2026 investor presentation, Increasing Return of Capital to Equity Holders; 2026 is guidance furnished 8 May 2026 [28].
Coverage. On the company's distributable-cash-flow definition, coverage has fallen from about 270% in 2022 to a guided 160% for 2026, and the threshold itself was cut from 160% to 150% in February 2026 alongside a $0.15 per unit, 10% distribution increase [29]. On the framework's adjusted-FCF basis the picture is tighter: the $1,070 million paid to common unitholders in 2025 against $875 million of adjusted FCF available to common is 0.82x cover, and against the M&A-normalised $1,362 million, 1.27x. In a year with $2,651 million of acquisitions and a $3.3 billion divestiture pending, part of the distribution was funded by the balance sheet. Headroom exists on the company's own measure; it is thin on Ruchir's.
The record through a downturn is a cut. Distributions per common unit paid were $1.38 in 2019, $0.90 in 2020 and $0.72 in 2021 — a 48% reduction across the 2020 collapse [15]. The 2025 rate of $1.52 is still 10% below the 2019 level six years later. A yield case here has to underwrite a distribution that was halved once inside the last six years, and the coverage buffer is the only thing standing between the payout and a repeat.
Commitment language and what would force a cut. Management has named distribution growth its primary return-of-capital vehicle on every recent call and has delivered the $0.15 per unit annual step for four consecutive years [21] [28]. The covenants do not threaten it: distributions are unrestricted while Plains is in compliance, and 4.1x sits well inside the 5.00x limit [2]. What would force a cut is a sustained EBITDA decline large enough to push leverage toward the covenant or to threaten the BBB rating — the 2020 pattern, when volume and margin collapsed together. The coverage buffer absorbs roughly a 37% fall in distributable cash flow before the 2026 distribution is uncovered on the company's own definition.
Promise Against Delivery
The sample is the five most material forward commitments made two to four years ago, checked against what happened.
Sources: Q4 2021 earnings call, 9 February 2022 [23]; Q2 2024 earnings call, 2 August 2024 [33]; Q4 2024 earnings call, 7 February 2025 [34]; 3Q25 earnings presentation, 5 November 2025 [35]; distribution and coverage history from the May 2026 investor presentation [28] and the February 2026 earnings deck [29].
The pattern is legible. Plains is reliable on what it controls — leverage targets, deal execution, the cost programme, the distribution cadence — and unreliable on basin volume forecasts and on the last mile of its own EBITDA range, having missed a range it had narrowed one quarter earlier. On the repurchase half of the February 2022 commitment, the follow-through was absent. Asked on that same call how the 25% equity-holder allocation would split between distributions and buybacks, the CEO answered that "our goal is to get our leverage down. But once that happens, it gives a significant amount of capacity to return to unitholders" [24]. The leverage did come down; the capacity went to distributions.
That is a delivery record, not a promotional one. The distinction Ruchir draws is between managers who talk their book without owning it and managers whose forecasts are simply hard. The ownership evidence points firmly to the second. As of 23 March 2026 the named executive officers held approximately 10.9 million units of PAA and PAGP equity worth about $238 million, and all executive officers and directors together held approximately 57.8 million units worth about $1.3 billion; each named executive held securities worth more than 14 times base salary at year-end 2025; and hedging, pledging and margin-account holdings of company securities are prohibited outright [26]. The CEO added $2.0 million of stock with his own money in 2023 [25]. CEO total compensation of $12.3 million against a 91:1 pay ratio is unremarkable for the asset base. Checked across the transcript archive and the proxy, the promotional-management exclusion does not fire here.
What would change this read
Three things, in order of how quickly they would show. A repurchase authorisation increase with cash behind it once leverage reaches the bottom of the target range would convert the fourth priority into a real one — the existing $190 million of unused capacity is the tell to watch [10]. A unit count that turns down for two consecutive January record dates would answer the share-count condition on evidence rather than intent. And an adjusted yield reaching the framework's levered bar would require either a price roughly two-thirds below today's or adjusted FCF available to common roughly tripling — neither is in the consensus path shown in Yield.
The counter-case is worth stating in the same breath: on the company's own measures the balance sheet is stronger than at any point in this record, the divestiture has landed $3.3 billion of cash, and the distribution has compounded at 19% a year for four years. An investor who wants a covered 6.3% yield from an investment-grade crude midstream is being offered exactly that. An investor who wants the repurchase flywheel is being offered the fourth line item.
What this tab establishes
The re-rating this tab exists to time has largely already run. PAGP's 2025 drawdown was 23.9% peak to trough, round-tripped in 386 days, and the shares closed 31 July 2026 at $26.33 — 56.3% above the October 2025 low, 19.0% above the pre-drawdown peak, and 6.8% above the street's mean target. The named mechanisms — the Canadian NGL divestiture, the EPIC/Cactus III purchase, the cost programme — have closed or fired. Listed options run to January 2028; 30-day implied volatility was 19.7%.
The mechanisms, and where each one stands
The re-rating case for Plains was never an industry repricing cycle. It was a company-specific self-help sequence that management named, dated, and then executed inside eighteen months. The table below is that sequence, with what each step was worth and when it landed.
Sources: 4Q25 investor deck, 6 February 2026 [1] and its initiatives page [2]; 1Q26 investor deck, 8 May 2026 [3]; completion release, 12 May 2026 [4]; Q1 FY2026 earnings call, 8 May 2026 [5]; news archive [6].
Three things about that sequence matter for timing.
The guidance reset ran the right way, and the street followed. Management set 2026 EBITDA guidance at $2,750mm plus or minus $75mm on 6 February 2026 [1], then raised the midpoint by $130mm to $2,880mm on 8 May [3]. The CFO attributed $70mm of the raise to the NGL segment — first-quarter outperformance plus ownership of the assets into May — and $60mm to the oil segment from captured optimisation, FERC tariff escalators, higher spot tariff volumes and West Coast volumes [5]. Consensus moved with it: FY2027 normalised EPS went from $1.77 six months ago to $2.19 now, and FY2028 from $1.885 to $2.35 — revisions of 23.7% and 24.6%. A low bar being cleared is a re-rating mechanism; this one has been cleared already.
Cost normalisation is roughly half rolled off. The February deck identified $100mm of annual savings through 2027 from general-and-administrative reduction, regional office closures and the exit of lower-margin operations, with about half to be realised in 2026 [7]. The May deck confirmed the $50mm of 2026 corporate efficiencies and the $50mm of Cactus III synergies were on track [3]. The remaining roughly $50mm is a 2027 item — about 1.7% of guided EBITDA.
The denominator is not shrinking. Asked directly about capital-allocation priorities on the February 2026 call, the CFO put the NGL proceeds toward debt paydown and said the primary route for returning cash is distribution growth, with preferred and common unit repurchases "more on an opportunistic basis" [8]. The buyback flywheel — repurchases compounding a high adjusted yield into EPS — is not one of the mechanisms available here on management's stated plan. The share-count and repurchase record is set out in Self-Help.
What is still on the calendar
Sources: news archive, 6 July 2026 distribution and earnings-timing release [6]; Q1 FY2026 earnings call [5] [9] [10]; 1Q26 investor deck [11]; 4Q25 call [12]; consensus estimates as of 2 August 2026.
The largest genuinely open item is volume and rate, not cost. Guidance assumes Permian production flat year on year at roughly 6.6 million b/d, with pipeline volumes on the Plains system nonetheless rising from 7,333 Mb/d in 2025 to 7,965 Mb/d guided for 2026 [13]. The CFO said any pickup in producer activity "would likely benefit 2027 and beyond" and pointed to new gas egress projects starting later this year as the unlock [5]; the Chief Commercial Officer put 200,000 to 300,000 b/d of Delaware Basin production behind pipe on negative Waha gas spreads [10]. On recontracting he offered a window rather than a number: "we hope to have updates in the coming quarters" [9].
Two dated items cut the other way. On 15 June 2026 Plains raised 2026 growth capital from about $350mm to $400–450mm net to PAA for Permian long-haul, Permian gathering and Canadian gathering projects, holding maintenance capital at about $185mm — spending that lands before the associated cash flow. And the 5 January 2026 distribution release warned that PAGP will carry positive earnings and profits in 2026 as a result of the NGL sale, making part of the Class A distribution taxable as a dividend rather than a return of capital [6]. That is a PAGP-specific after-tax drag in the same year the mechanisms were meant to pay.
One feared event did fail to happen, and it is worth recording as such: Canada's Competition Bureau sued to challenge the Keyera transaction, and both parties closed it anyway on 12 May 2026 [9] [4]. Net proceeds came in at roughly $3.3bn, about $100mm above the prior estimate, and the expected special distribution was dropped entirely because the Cactus III purchase absorbed most of the unitholder tax liability [5].
Base rates from this name's own history
PAGP has been listed since 16 October 2013. Over the nearly thirteen years since, the daily close series contains twelve distinct drawdown episodes of 20% or deeper, measured peak-to-trough on closing prices.
Source: derived from the run's daily closing-price series for PAGP, 16 October 2013 to 31 July 2026 (3,217 sessions), as reported.
The chart carries one fact the episode arithmetic does not. The June 2014 peak of $85.19 has never been regained: at $26.33 the shares sit 69.1% below it after twelve years. Whatever else this name has done, it has not been a franchise whose price swings around a rising intrinsic value; the 2014 high belonged to a general-partner structure with incentive distribution rights and a different distribution policy, and the business that replaced it has traded in a lower band since.
Source: derived from the run's daily closing-price series, using a 20% zig-zag threshold to define peaks and troughs; "regained" is the first subsequent close at or above the prior peak close. As reported.
The arithmetic a sceptic can recompute: depth is trough close divided by peak close minus one; the day counts are calendar days between the dated closes. Across the twelve episodes the median depth is 28.7% and the median time to trough 116 days. Nine of the twelve regained their pre-drawdown peak. Among those nine the median round trip, peak to trough to recovery, was 201 days — 6.6 months — and seven completed inside 24 months.
Source: derived from the run's daily closing-price series; the three episodes that never regained their peak are excluded and listed in the table above.
The relationship is the base rate. Every one of the seven episodes that round-tripped inside two years was shallower than 40%. The two deep episodes that did recover took 26.5 months (the September 2020 low) and 82.6 months (the March 2020 low, regained only on 21 May 2026 — a 6.9-year round trip). The three that never regained their peak were 69.2%, 46.3% and 27.0% deep; the 2018 peak of $26.91 remains 2.2% above today's close, eight years on.
Applied to the setup the framework hunts, this is a caution rather than a comfort. A 60–70% capitulation drawdown of the kind the system looks for has occurred twice in PAGP's history, in 2015–16 and in 2019–20, and neither round-tripped inside 18–24 months: one took nearly seven years and the other has never recovered. The 2025 episode was not of that kind — 23.9% deep on a volume spike of 1.59x prior-period median, quantified in Dislocation — and it behaved like the shallow cohort, recovering in 386 days.
The 18-month test
The read: on this evidence, the eighteen-to-twenty-four-month question does not arrive in its usual form, because the gap it would close is no longer open. The shares are 56.3% above the October 2025 trough ($26.33 against $16.85), 19.0% above the January 2025 peak, and 6.8% above the street's mean target; every mechanism management named has fired or closed; and the residual catalysts — roughly $50mm of 2027 cost savings, a leverage move already three-quarters done, a $0.15 per unit distribution step — are increments on a delivered plan, not a re-recognition of value the market has refused to see. What remains inside eighteen months is ordinary delivery: a 6.3% distribution yield at $1.67 per unit on a $26.33 close, growing about 9% a year on management's targeted step, against consensus that has EBITDA effectively flat through 2028.
What would falsify that read: a Permian long-haul recontracting round or an EPIC expansion signed at rates materially above the existing book, which management has said it hopes to report "in the coming quarters" [9]. That would put a step-change into 2027 EBITDA against a consensus base that currently assumes none, and would reopen a gap on the framework's terms. The mirror falsifier is the same variable in reverse — recontracting at flat or lower rates, or Permian volumes failing to convert the 200–300 Mb/d behind pipe — which would leave 2027 EBITDA below the 2026 guided level and turn the delivered plan into the peak.
What consensus expects, and when
The shares trade above the sell side's mean target. Consensus mean is $24.64 across 14 estimates, median $24.50, high $29, low $20; the 31 July 2026 close was $26.33 — 6.8% above the mean and 10.1% below the high.
Mean target
Median target
High target
Low target
Source: consensus estimates summary as of 3 August 2026 [14].
The positioning is split rather than capitulated: 6 buy plus 1 outperform, 6 hold, 2 underperform and no outright sell, for a consensus recommendation score of 2.27 on a one-to-five scale [14]. That is the profile of a name the street already understands and has priced — not one it has given up on. The framework's edge case is the opposite: coverage cut, targets slashed, the buy side scared while the sell side still points higher. Here the buy side has already paid past where the sell side points.
Source: consensus quarterly estimates for PAGP as of 2 August 2026; figures are mean estimates in $ millions, as reported.
Source: consensus annual estimates for PAGP as of 2 August 2026; mean estimates, as reported.
The shape of that path is the answer to when consensus itself expects a recovery to show in printed numbers: it does not expect one at the EBITDA line. Consensus FY2027 EBITDA of $2,813mm sits 2.4% below the FY2026 guided midpoint of $2,880mm, and FY2028 of $2,919mm is 1.3% above it — two years of essentially flat operating cash generation. What grows is below EBITDA: normalised EPS from $1.95 to $2.35 between 2026 and 2028 (+20.2%) and free cash flow from $1,580mm to $1,948mm (+23.2%), which is what deleveraging from 4.1x toward the low end of 3.25x–3.75x does to interest expense [11].
The candidate quarter, on that arithmetic, is 4Q26 — reported in February 2027. It is the first print that carries a full year of Cactus III, the completed half of the cost programme, post-divestiture leverage inside the target band, and the initial FY2027 guidance that would have to contain any recontracting uplift. The 7 August 2026 Q2 print is a checkpoint on the raised guidance, not a repricing event: consensus for the quarter is $0.44 normalised EPS on $713mm of EBITDA, below the $730mm the company reported in 1Q26.
The instrument facts
Listed options exist on PAGP, with expiries beyond twelve months.
Source: Nasdaq published PAGP option chain, retrieved 3 August 2026; open interest in contracts, months out measured from 3 August 2026.
Six expiries are listed, running from 21 August 2026 to 21 January 2028. The longest-dated series is 17.6 months out, so contracts of at least twelve months' duration exist, and the longest available sits just short of eighteen. Open interest across the whole chain is 108,753 contracts. The January 2028 series carries 17,294 contracts across thirteen strikes spanning $3 to $35 — 15,393 calls and 1,901 puts — and traded 53 contracts on the retrieval date, so open interest is present but daily turnover in the long-dated line is thin relative to the front months, where November 2026 alone holds 48,211 contracts.
Implied volatility, dated: on 31 July 2026, AlphaQuery's PAGP volatility statistics put 30-day mean implied volatility at 19.68% (18.62% on calls, 20.73% on puts), 120-day mean at 20.61% and 180-day mean at 20.20%, against close-to-close historical volatility of 15.93% over 30 days and 19.67% over 180 days. The framework's reference lines treat up to roughly 50–55 as acceptable and 60–70 as elevated; PAGP's term structure sits well below the lower line, with 30-day and 180-day implied volatility within a percentage point of each other. No implied-volatility figure beyond 180 days was obtainable from a dated, citable source, so the January 2028 series is not characterised here on volatility.
Where a name has no qualifying long-dated options, the framework routes it to a watchlist rather than the book. That consequence does not apply to PAGP: qualifying expiries exist, with open interest behind them.
The data gap that bounds this tab
fit_features.json could not compute market capitalisation for PAGP — no positive annual period-end or outstanding share count was available in the feed — and, in consequence, could not compute the adjusted free-cash-flow yield, the yield baseline, the balance-sheet class or the float-retirement years. It also carries no stock-based compensation for any of FY2016–FY2025, so adjusted free cash flow is not_computable in every year. Timing statements on this tab therefore rest on price, dated company disclosure and consensus, not on a yield that would say how much of the re-rating is already in the price. The yield arithmetic, with whatever the primary filings support, is set out in Yield; the leverage and distribution mechanics in Self-Help.