Annual Reports
Plains GP Holdings, L.P.'s annual reports contain management's most considered account of the business. These are the sections, passages and visual pages worth opening in the originals preserved in Sources.
Plains GP Holdings, L.P. — FY2025 Annual Report (Form 10-K) — FY2025
The first 10-K written as a crude-oil pure play: the Canadian NGL business is held for sale and restated into discontinued operations. · Open the full document →
Items 1 and 2. Business and Properties — General — p. 8 · Read the full section →
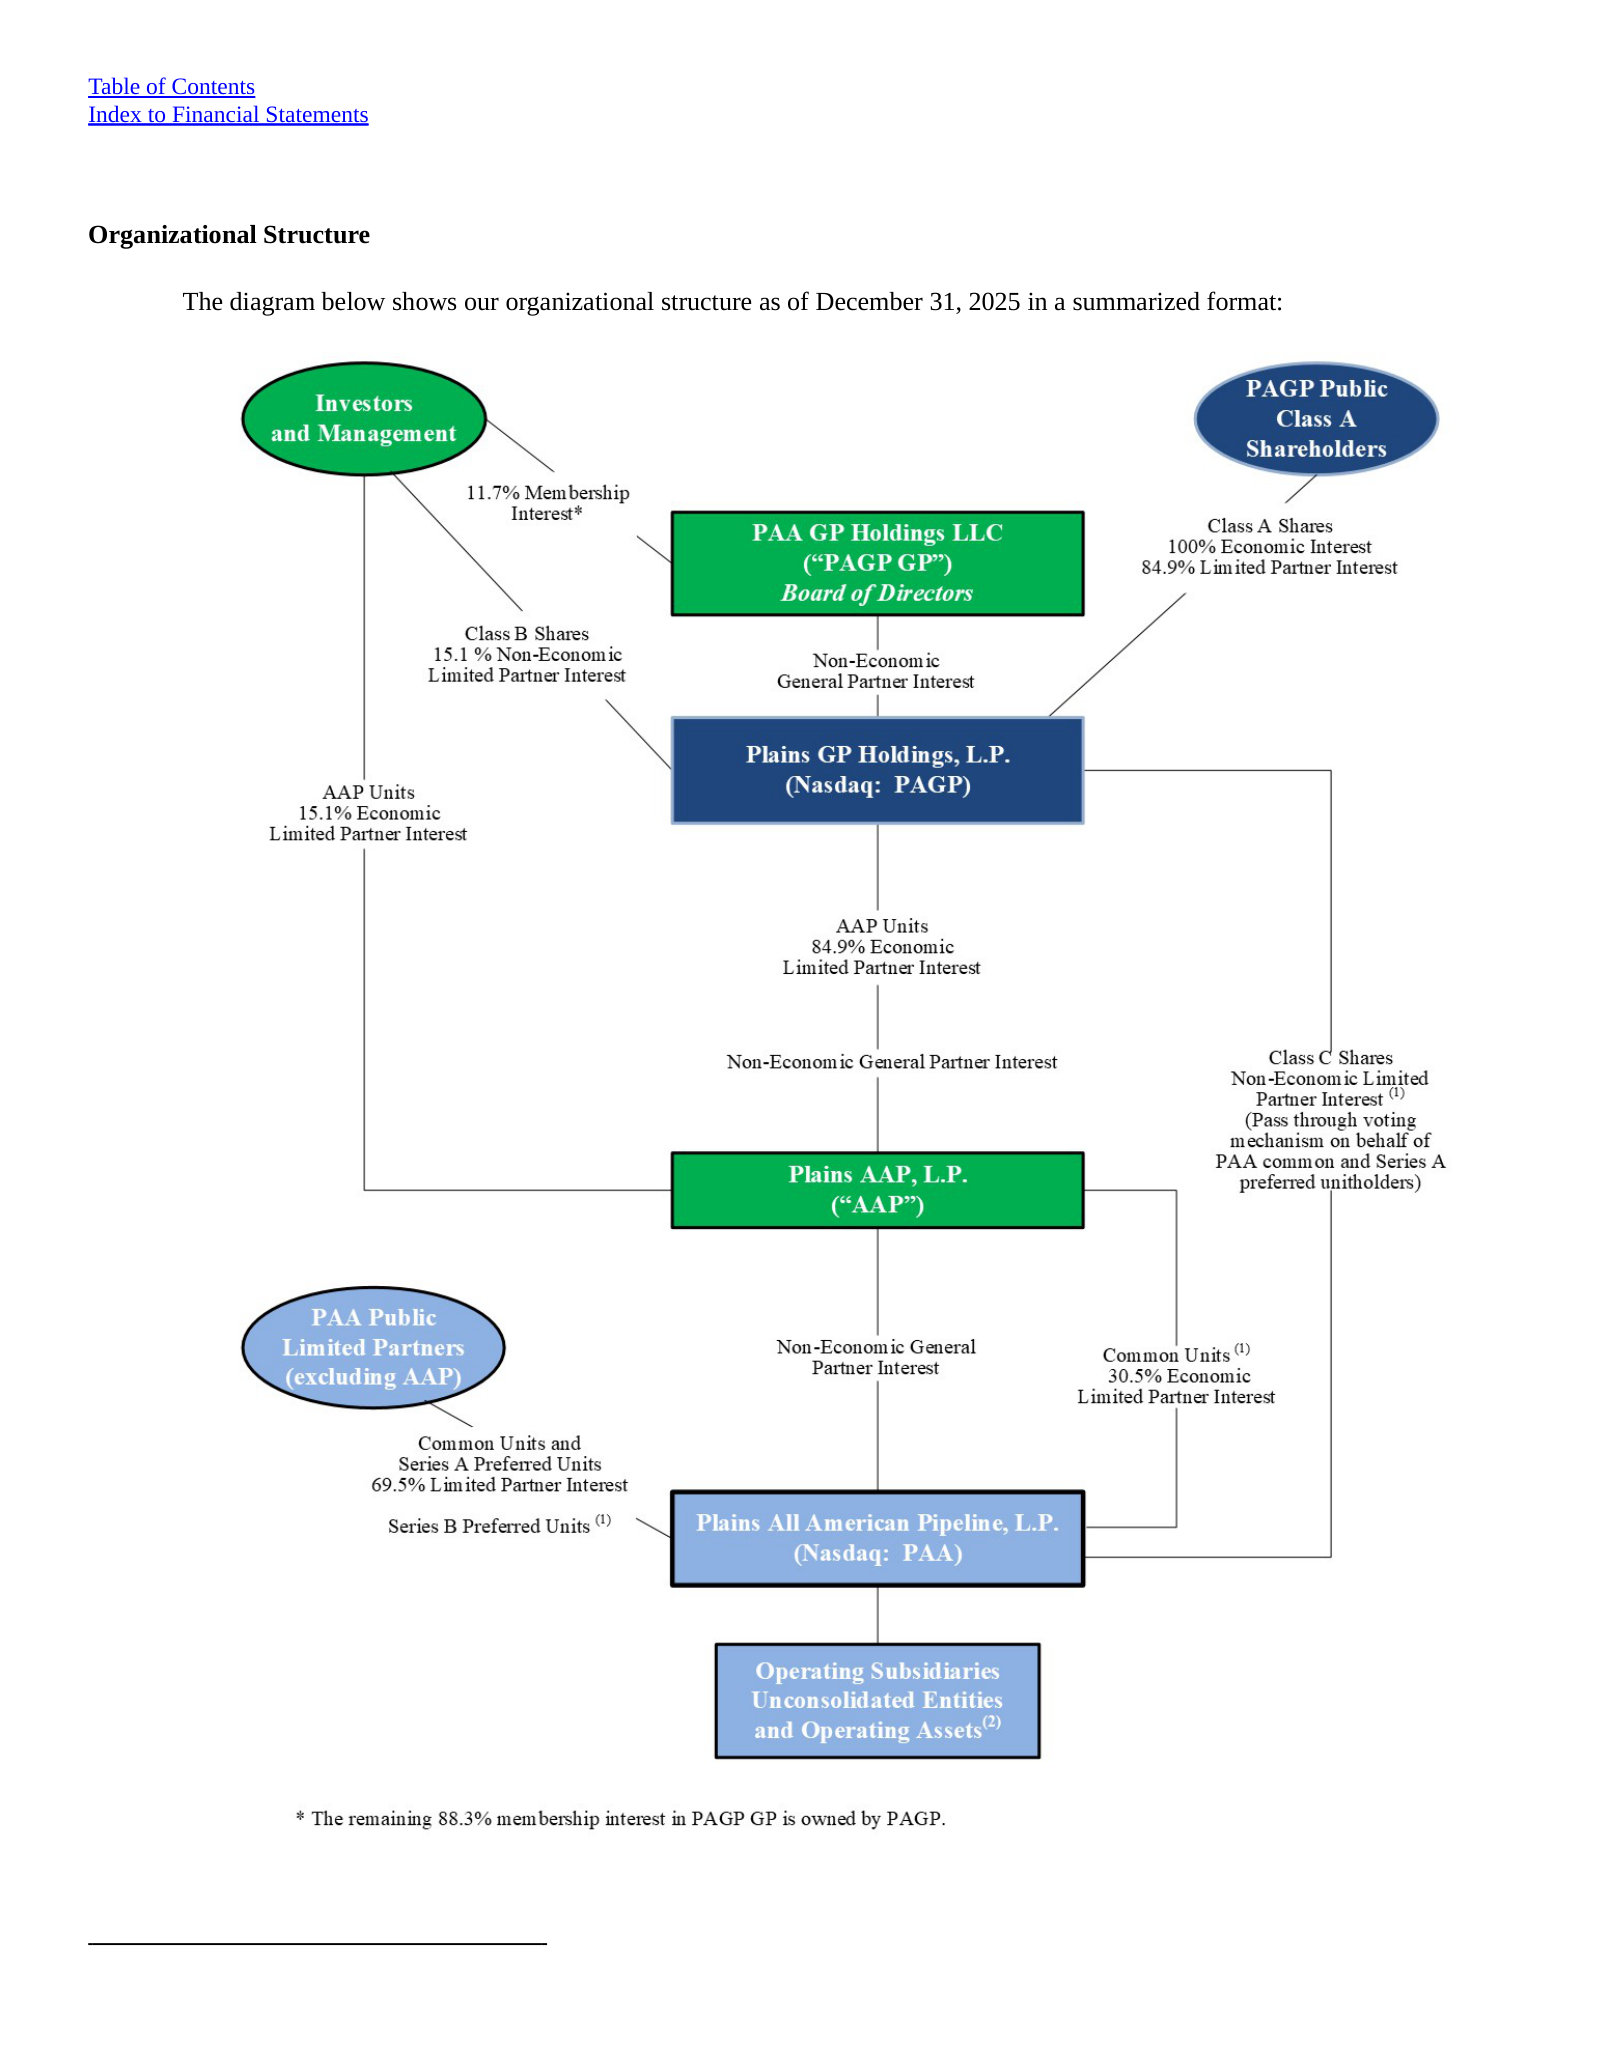
States the two facts that define PAGP: it owns no operating assets, and it is selling substantially all of its NGL business.
Our Business Strategy — p. 11 · Read the full section →
Explains Economic Parity — why one Class A share tracks one PAA common unit — and PAA's stated shift to a crude-only business.
Crude Oil Segment — p. 15 · Read the full section →
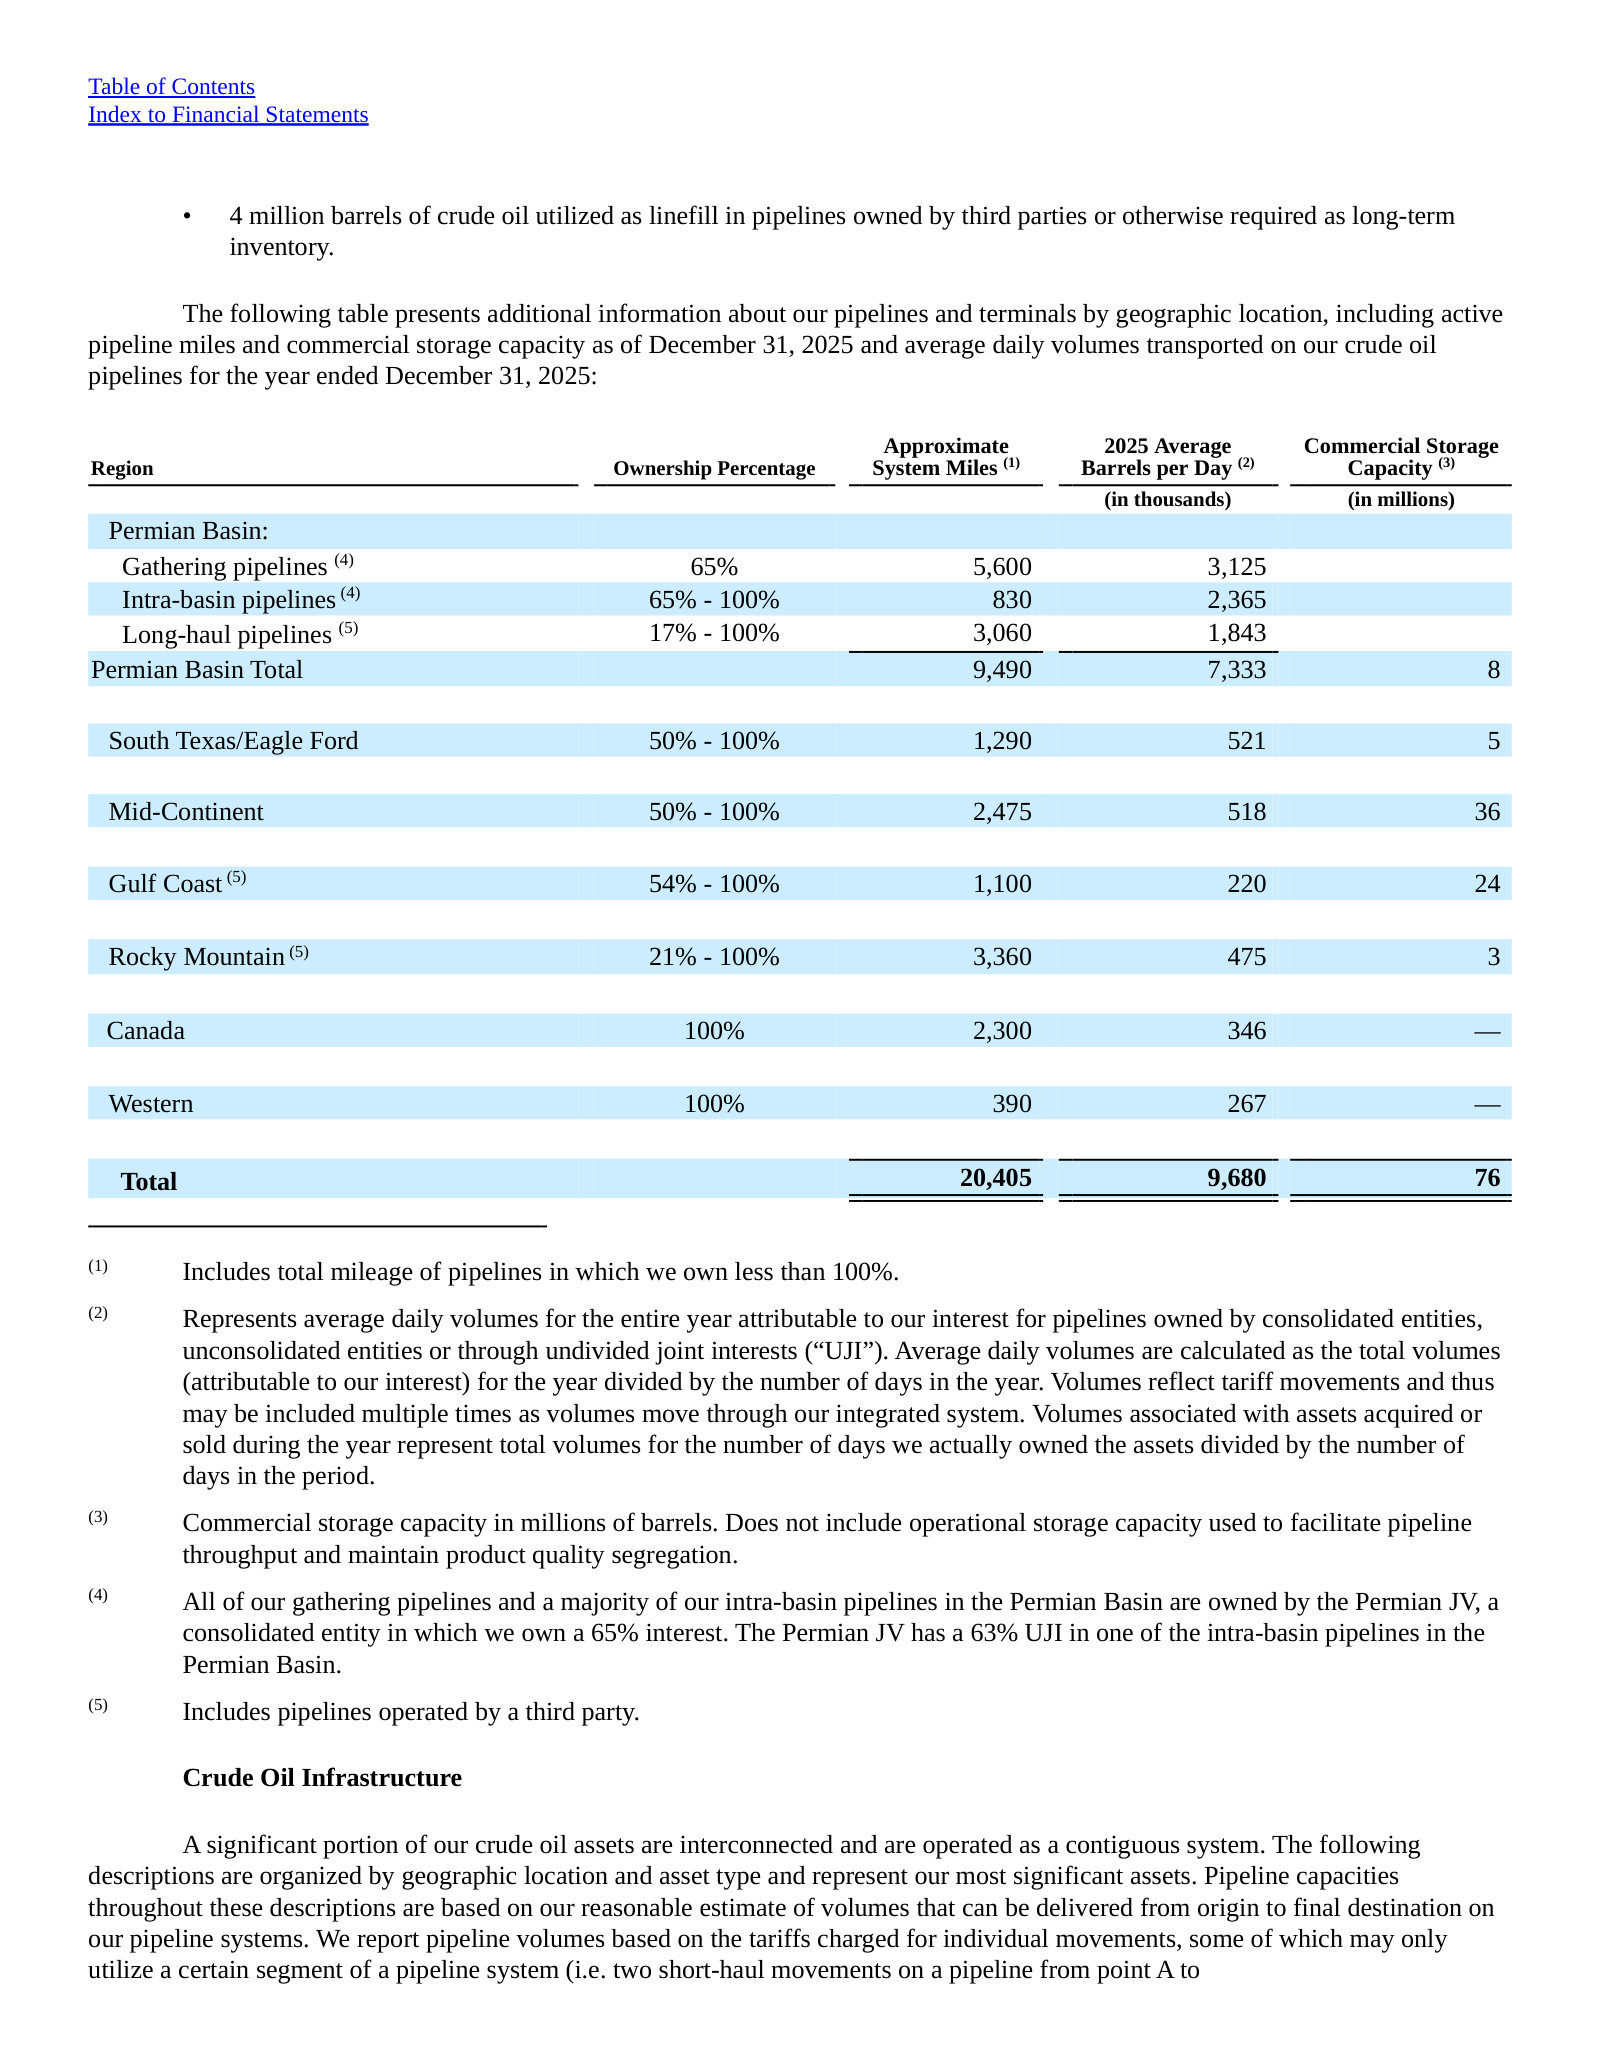
The segment that is now essentially all of continuing operations; sets out which dollars are tariffs and which are merchant margin.
How the crude segment earns: tariffs and capacity agreements, storage and terminalling fees, plus merchant activity.
Our Crude Oil segment operations generally consist of gathering and transporting crude oil using pipelines (including gathering systems), trucks and, at times, on barges or railcars, in addition to providing terminalling, storage and other related services utilizing our integrated assets across the United States and Canada. Our assets provide services to third parties as well as to our merchant activities. Our merchant activities include the purchase of crude oil supply and the movement of this supply on our assets or third-party assets to sales locations, including our terminals, third-party connecting carriers, regional hubs or to refineries. […] With respect to the transportation assets in this segment, we primarily generate revenue through a combination of tariffs, pipeline capacity agreements and other transportation fees. With respect to our crude oil terminal and condensate processing assets in this segment, we primarily generate revenue through a combination of month-to-month and multi-year agreements and arrangements which include storage, throughput and loading/unloading fees at our crude oil terminals and processing facilities. We also generate significant revenue through a variety of commercial and merchant activities that often result in increased utilization of our transportation and storage assets.
p. 17 · Read in context →
NGL Segment — p. 29 · Read the full section →
The last full description of the Canadian NGL business before it leaves — extraction rights, replacement gas, hedged merchant margin.
What remains in the NGL segment versus the Canadian merchant model being sold.
Our NGL segment operations involve NGL storage and terminalling from our NGL assets located primarily in the Southwestern United States. Our NGL segment revenues are primarily derived from (i) providing storage and/or terminalling services at these facilities to third-party customers for a fee and (ii) the transport, storage and sale of specification NGL products. […] Our Canadian NGL Business merchant activities include the acquisition of extraction rights from producers and/or shippers of the gas streams that pass through our Empress facility. The extraction rights allow us to process that gas at our Empress facility and extract the higher valued NGL from the gas stream. We then purchase natural gas to replace the thermal content attributable to the NGL that was extracted. We use our assets to transport, store and fractionate NGL mix extracted from our Empress straddle plants, or NGL mix acquired from third parties, into finished products to sell to customers. We may also acquire finished NGL products to be seasonally stored in our storage caverns, which is then resold to third-party customers. Often times we will use derivative instruments to hedge the margins related to these merchant activities.
p. 29 · Read in context →
Impact of Commodity Price Volatility and Dynamic Market Conditions on Our Business Model — p. 33 · Read the full section →
Management's own account of what commodity prices do and do not do to cash flow — the crux of the midstream model.
Absolute price levels are not the exposure; compressed regional differentials are.
While our objective is to position the Partnership such that our overall annual cash flow is not materially adversely affected by the absolute level of energy prices, market volatility associated with shifts between demand-driven markets and supply-driven markets or other similar dynamics may create market conditions that are more challenging to our business model. In extended periods of lower crude oil and/or NGL prices, or periods where the supply and demand fundamentals compress regional location differentials, our financial results may be adversely impacted. Under such market conditions, product flows on our pipelines or through our facilities may be adversely impacted. Alternatively, in periods where supply exceeds regional demand and/or pipeline egress, product flows on our pipelines or through our facilities may be favorably impacted. […] In addition, relative contribution levels will vary from quarter-to-quarter due to seasonality, particularly with respect to our NGL merchant activities.
p. 35 · Read in context →
Item 1A. Risk Factors — Risks Inherent in an Investment in Us — p. 67 · Read the full section →
PAGP's distribution is a pass-through of PAA's, and a $1.2 billion deferred tax asset sits behind reported book equity.
If PAA cuts its per-unit distribution, PAGP would likely cut its own.
The source of our earnings and cash flow currently consists exclusively of cash distributions from AAP, which currently consist exclusively of cash distributions from PAA. […] PAA may not have sufficient available cash each quarter to continue paying distributions at its current level or at all. If PAA reduces its per unit distribution, either because of reduced operating cash flow, higher expenses, capital requirements or otherwise, we will have less cash available for distribution and would likely be required to reduce our per share distribution.
p. 67 · Read in context →
A valuation allowance on the $1.2 billion gross deferred tax asset would hit earnings and capital immediately.
As of December 31, 2025, we had a gross deferred tax asset of approximately $1.2 billion. Generally accepted accounting principles in the United States (“GAAP”) requires that a valuation allowance must be established for deferred tax assets when it is more likely than not that they will not be realized. We believe that the deferred tax asset we recorded through 2025 will be realized and that a valuation allowance is not required. However, if we were to determine that a valuation allowance was appropriate for our deferred tax asset, we would be required to take an immediate charge to earnings with a corresponding reduction of partners’ capital and increase in balance sheet leverage as measured by debt-to-total capitalization.
p. 73 · Read in context →
Risk Factors — Risks Related to PAA's Business — p. 77 · Read the full section →
Names the operating risk already visible in results: overbuilt midstream capacity and Permian long-haul contracts resetting lower.
Recontracting risk on long-haul Permian pipelines amid excess midstream capacity.
These competitive risks make it more difficult for PAA to attract new customers and expose PAA to increased contract renewal and customer retention risk with respect to its existing customers and make recontracting at favorable rates and volumes more challenging, including, for example, with respect to certain of PAA’s long-haul Permian pipelines. […] A significant driver of competition in some of the markets where PAA operates (including, for example, the Eagle Ford, Permian Basin, and Rockies/Bakken areas) stems from the rapid development of new midstream energy infrastructure capacity that was driven by the combination of (i) significant increases in oil and gas production and development in the applicable production areas, both actual and anticipated, (ii) relatively low barriers to entry and (iii) generally widespread access to relatively low cost capital. While this environment presented opportunities for PAA, many of the areas where PAA operates have become overbuilt, resulting in an excess of midstream energy infrastructure capacity.
p. 79 · Read in context →
Item 7. Management's Discussion and Analysis — Executive Summary — p. 114 · Read the full section →
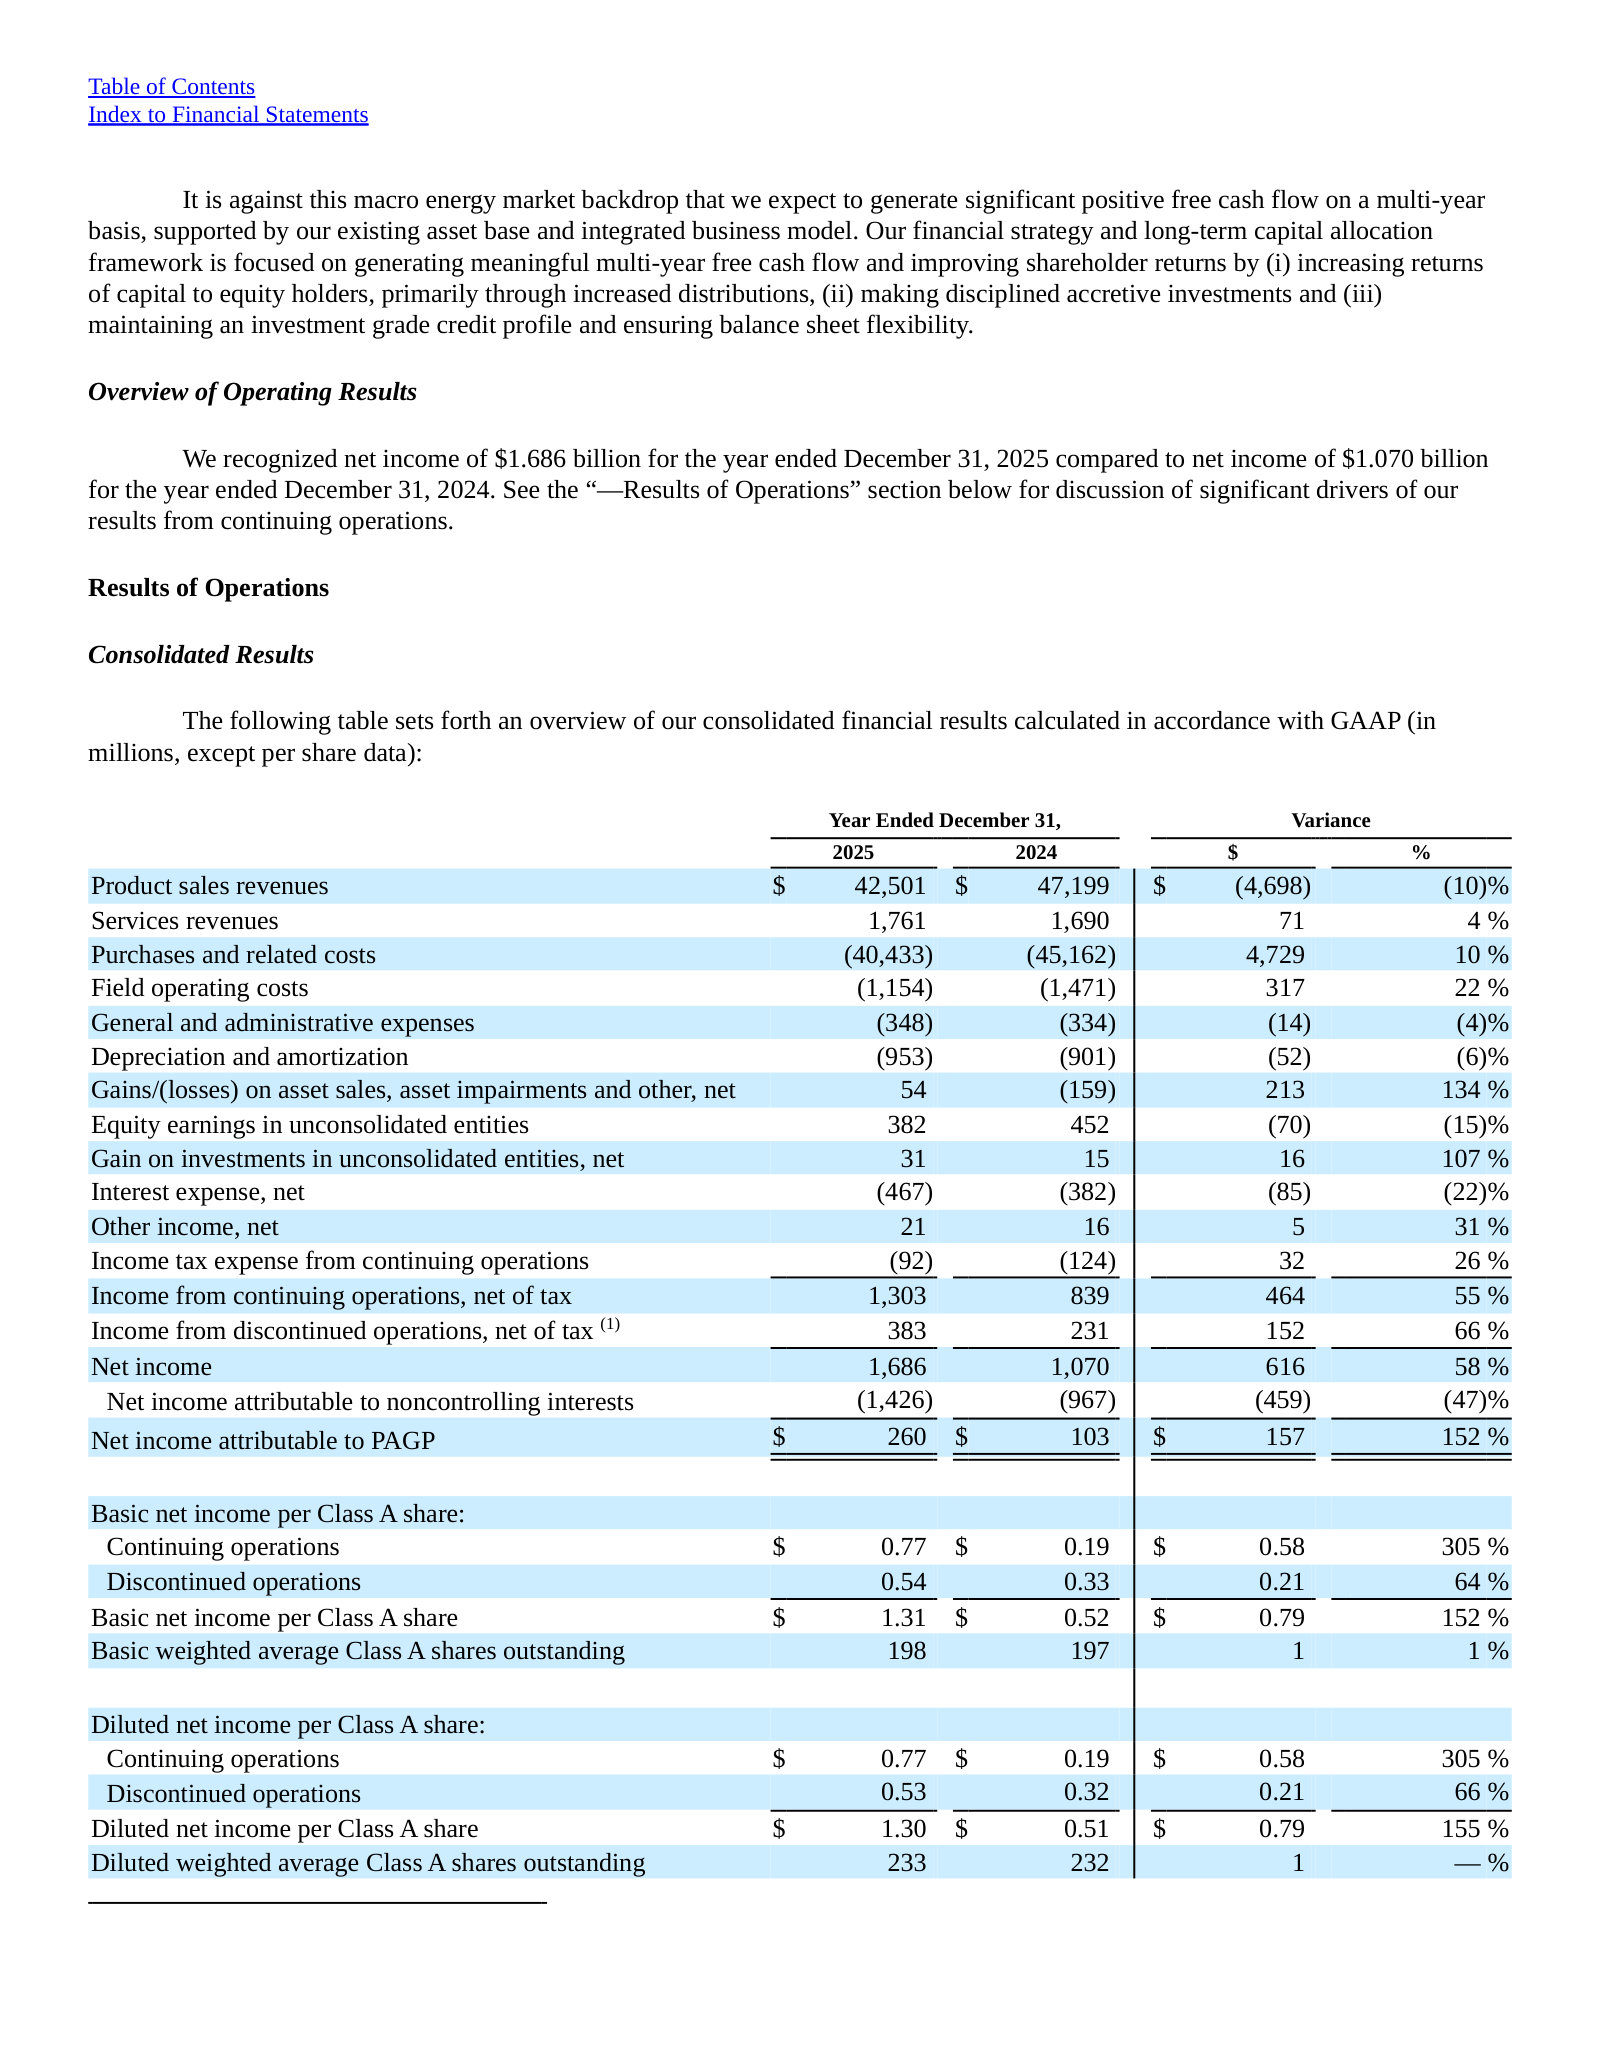
Management's rationale for the divestiture, and the consolidated table showing how little of net income reaches PAGP.
Why the Canadian NGL sale was done, and why prior periods were restated.
This transaction supports our strategic objective to focus on our core midstream crude oil operations and to reduce exposure to commodity price fluctuations and seasonality. […] We determined that in conjunction with entering into the SPA, the operations of the Canadian NGL Business meet the criteria for classification as held for sale and for discontinued operations reporting, as the sale will represent a strategic shift that will have a major effect on our operations and financial results.
p. 114 · Read in context →
Analysis of Operating Segments — p. 125 · Read the full section →
The segment tables and the paragraph where management attributes the year's EBITDA change to specific volume, tariff and contract effects.
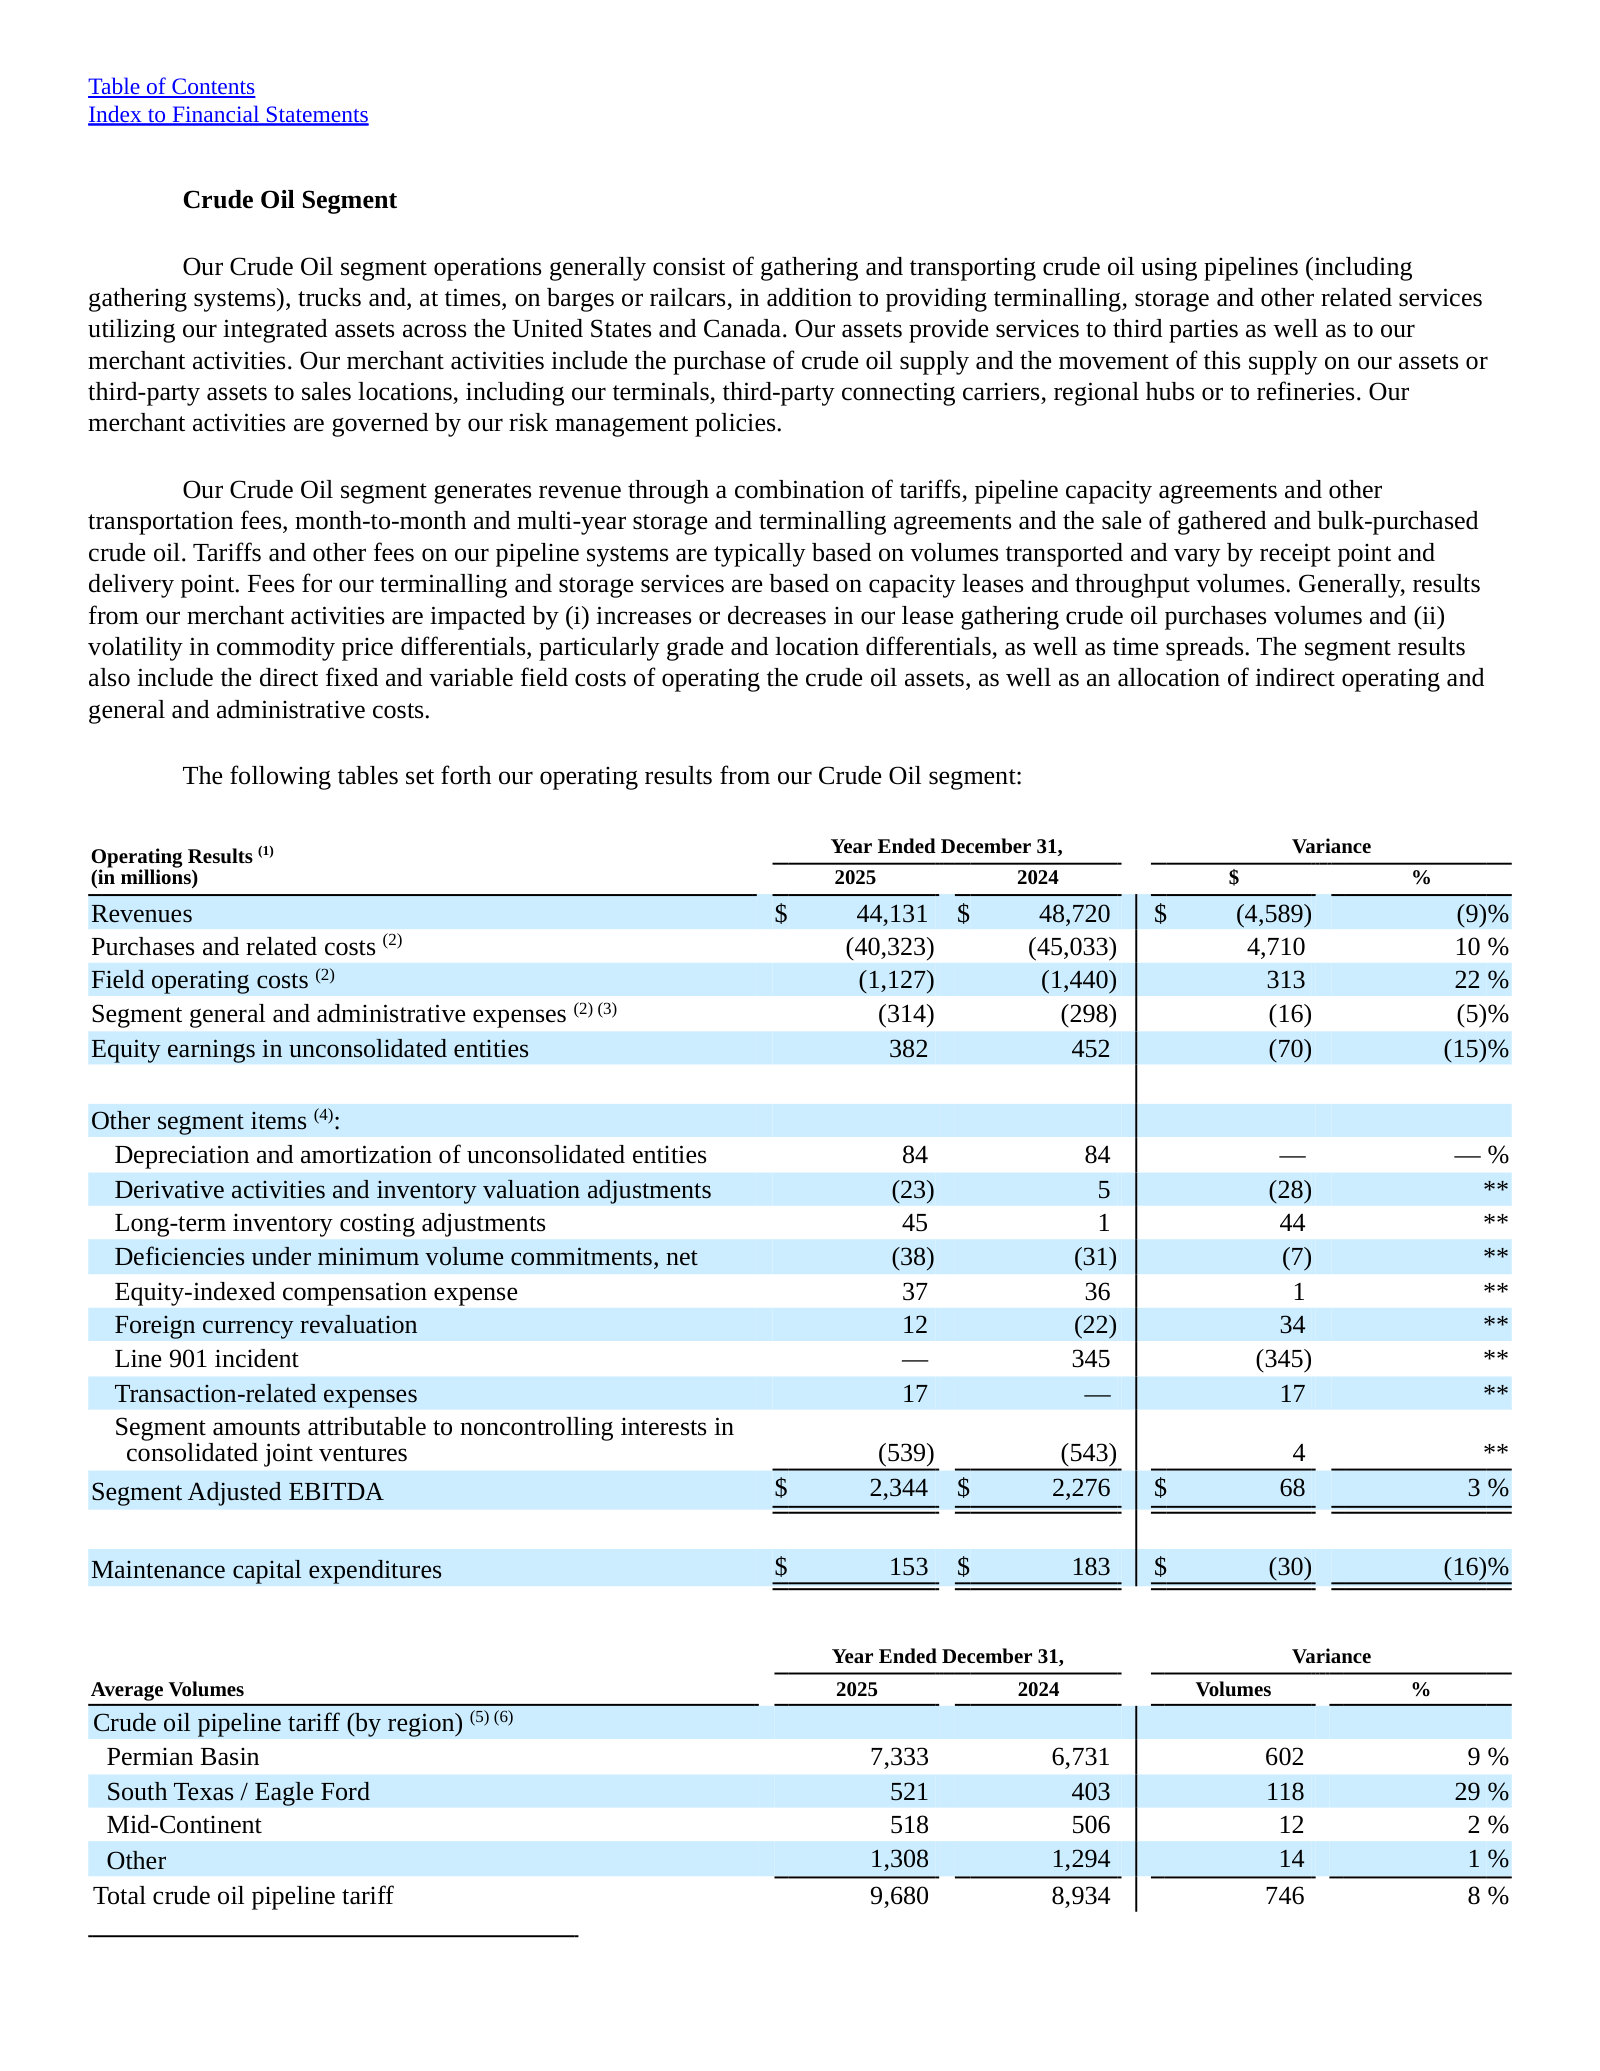
What moved Crude Oil Segment Adjusted EBITDA: Permian volumes and acquisitions against contract resets.
Crude Oil Segment Adjusted EBITDA increased for the year ended December 31, 2025 compared to the year ended December 31, 2024 primarily due to higher tariff volumes on our pipelines, contributions from acquisitions and the benefit of tariff escalations, partially offset by fewer market-based opportunities and the impact from certain contract rates resetting to market. […] Favorable results from (i) volume growth across our pipeline systems largely driven by increased production in the Permian Basin region, (ii) contributions from recently completed acquisitions in the Permian Basin and South Texas regions, including our Cactus III pipeline acquisition, and (iii) the benefit of tariff escalations were partially offset by (iv) fewer market-based opportunities, (v) lower commodity prices, which resulted in lower revenues from pipeline loss allowance in the 2025 periods, and (vi) the impact from certain Permian long-haul contract rates resetting to market in 2025.
p. 128 · Read in context →
Plains GP Holdings, L.P. — FY2024 Annual Report (Form 10-K) — FY2024
Here for one section: the NGL segment as reported before the Keyera sale, when it was a frac-spread and heating-season business. · Open the full document →
Analysis of Operating Segments — NGL Segment — p. 124 · Read the full section →
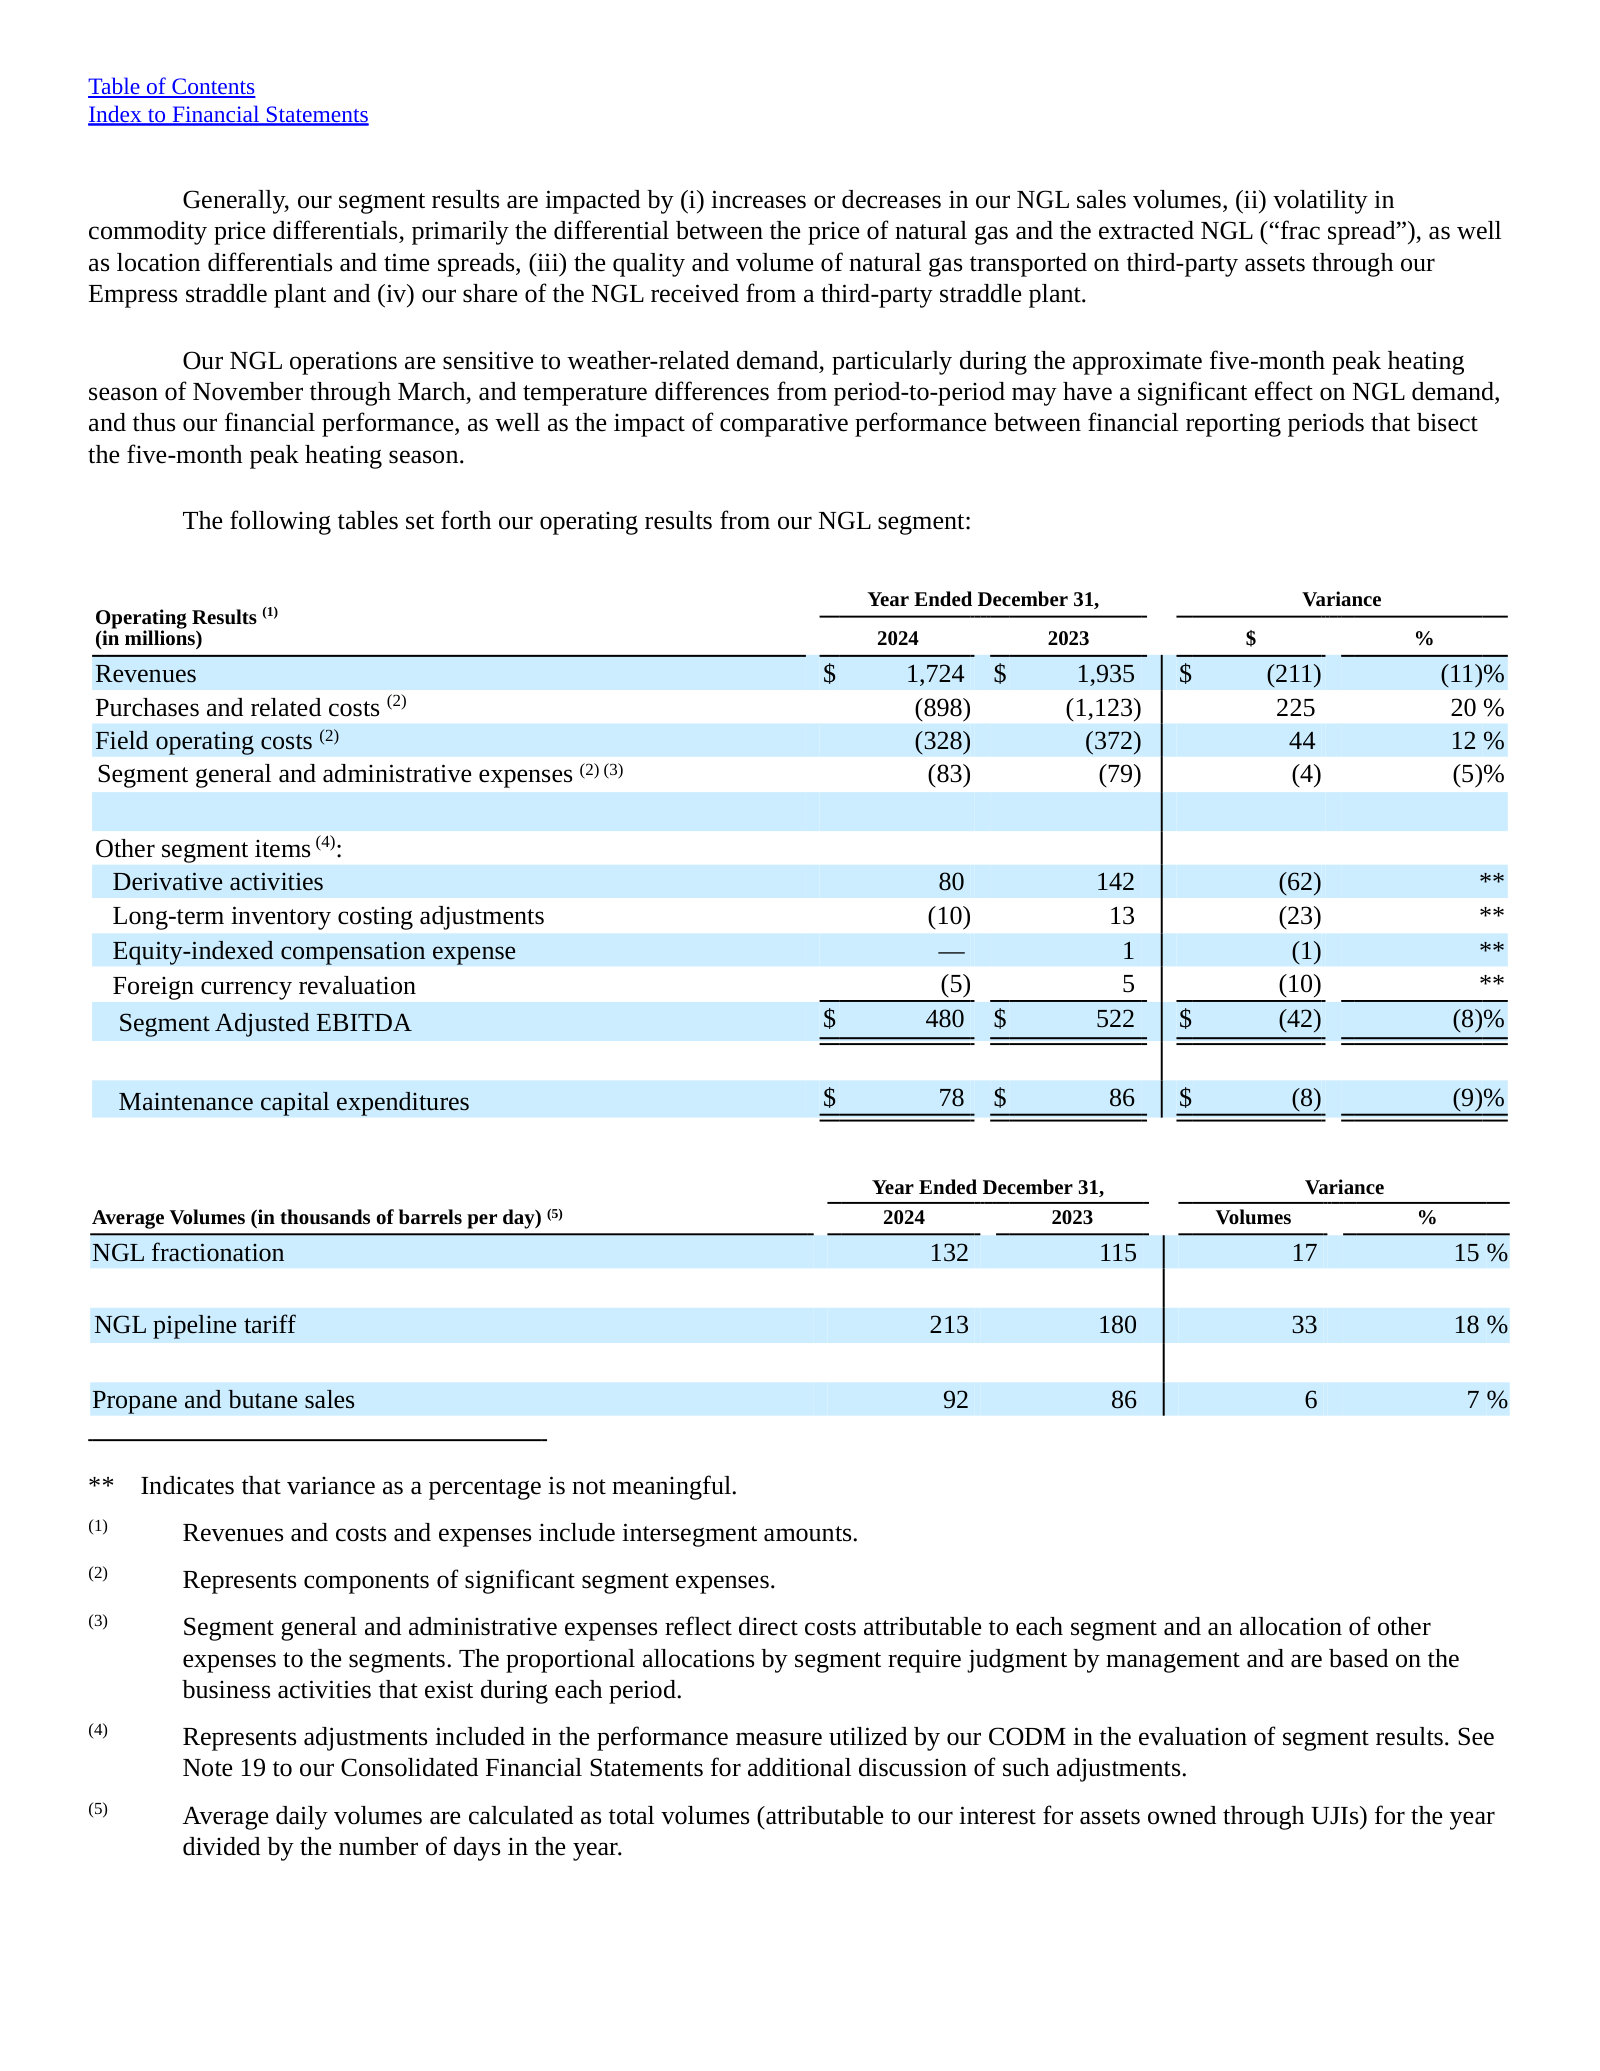
Shows what the divestiture removes: $1.7bn of revenue and $480m of Segment Adjusted EBITDA driven by frac spread and winter demand.
The pre-sale NGL earnings drivers: frac spread, straddle-plant gas quality, and a five-month heating season.
Generally, our segment results are impacted by (i) increases or decreases in our NGL sales volumes, (ii) volatility in commodity price differentials, primarily the differential between the price of natural gas and the extracted NGL (“frac spread”), as well as location differentials and time spreads, (iii) the quality and volume of natural gas transported on third-party assets through our Empress straddle plant and (iv) our share of the NGL received from a third-party straddle plant. […] Our NGL operations are sensitive to weather-related demand, particularly during the approximate five-month peak heating season of November through March, and temperature differences from period-to-period may have a significant effect on NGL demand, and thus our financial performance, as well as the impact of comparative performance between financial reporting periods that bisect the five-month peak heating season.
p. 126 · Read in context →
More annual reports
Plains GP Holdings, L.P. — FY2023 Annual Report (Form 10-K) — FY2023 · 249 pages · Baseline year for the FY2025 comparatives, with the NGL segment still consolidated and the Permian JV ramping. · Open →
Plains GP Holdings, L.P. — FY2022 Annual Report (Form 10-K) — FY2022 · 265 pages · The peak-price year: shows how much of the segment result comes from differentials rather than fee-based volume. · Open →
Plains GP Holdings, L.P. — FY2021 Annual Report (Form 10-K) — FY2021 · 275 pages · First 10-K under the Crude Oil / NGL segment presentation, and the last with the distribution at its post-cut level. · Open →